Starting out in performance marketing, the metrics alone can be intimidating. CTR, CVR, CPC, CPM, CPI, CPA, ROAS, LTV… it's easy to burn out trying to memorize the whole glossary. But in practice, the ones you actually look at every day are far fewer. To start, four is enough. Today let's look at what those four are — and how to read them instead of memorizing them.
Learn metrics as "questions," not definitions
Here's the most common mistake junior marketers make: memorizing the definition of a metric. Something like "CTR is clicks divided by impressions."
Knowing the definition doesn't actually help you in practice. When your dashboard shows a CTR of 1.2%, the definition doesn't tell you "so what do I do about it?" A metric isn't a formula — it's a question. Each metric answers a different question. Once you know the question, the number starts talking to you.
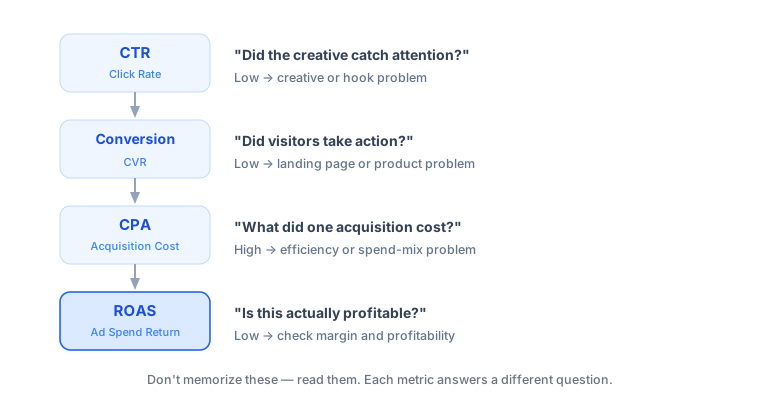
These four are everything you need to start with. Let's go through them one by one.
1. CTR — "Did the creative catch attention?"
This is the percentage of people who clicked after seeing your ad. It's essentially a creative report card. A weak hook, an unremarkable thumbnail, or boring copy will show up right here.
If CTR is low, fixing your landing page won't help — the click never happened in the first place. Look at the creative first.
One thing to watch out for: what counts as a "normal" CTR varies wildly by platform, industry, and audience. Don't blindly borrow someone else's benchmark (like "2% is a good CTR"). Comparing against your own account's trend over the past few weeks is far more accurate.
2. Conversion Rate (CVR) — "Did visitors take action?"
This is the percentage of people who clicked through and actually signed up or purchased. If this is where things fall apart, the problem lives outside the ad itself — think landing page, pricing, the product, or the checkout flow.
Looking at CTR and CVR together reveals something interesting. Good clicks but no conversions? The ad might have overpromised, creating a mismatch between expectation and reality. The creative sold too well and pulled in people who were never going to buy.
3. CPA — "What did it cost to acquire one?"
This is the ad spend behind a single conversion — the number that comes up most often in day-to-day conversations.
Here's something important to know: a rising CPA doesn't automatically mean something got worse. Even if every channel's own CPA stays flat, simply shifting budget toward a more expensive channel will push the overall blended CPA up. If you skip that breakdown and jump straight to overhauling creative, you're wasting effort. We covered this in more detail in how to lower CPA.
4. ROAS — "Is this actually profitable?"
This is revenue divided by ad spend, and it's the number that finally tells you whether things went well or badly.
One caveat here too: ROAS is based on revenue, so it ignores margin. A ROAS of 300% can still lose you money if your cost of goods is high. And the ROAS your dashboard shows also includes conversions that would have happened anyway, even without the ad. Filtering that out is what incrementality measurement does — a great topic to dig into once you're more comfortable with the basics.
Real skill shows up when you read all four together
Knowing what each one means is just the starting point. The real skill is lining all four up and narrowing down the problem based on where the red flag first shows up.
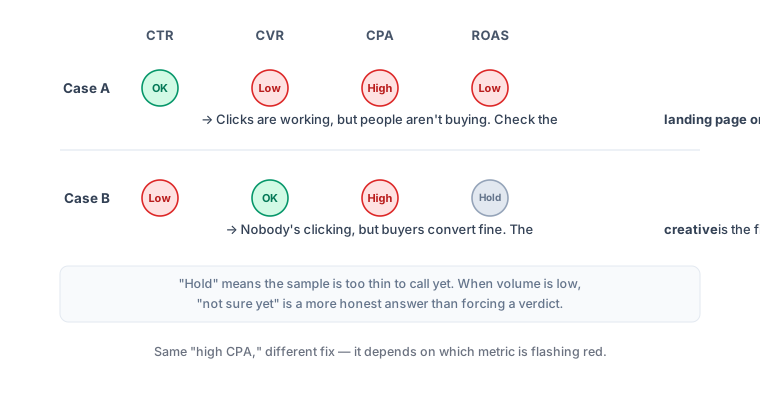
Look at Case A. CTR is normal, but conversion rate is low. Clicks are happening fine, but people aren't buying. Making new creative here would be wasted effort — the landing page or the product needs attention.
Case B is the opposite. CTR is low, conversion rate is normal. The people who land are buying just fine — the problem is nobody's clicking in the first place. Here, creative is the answer.
Both cases show the exact same high CPA. If you were only looking at CPA, you couldn't have told these two cases apart. That's exactly why you need to read the metrics together.
When the numbers are thin, "not enough data yet" is the right answer
One last, and probably the most important, habit. Notice the ROAS box in the diagram above marked gray, "hold"? That's what it looks like to defer judgment when there isn't enough data.
The CPA of a campaign with 3 conversions is nearly meaningless — one more conversion the next day can swing the number wildly. Not knowing this leads to a familiar mistake: killing a campaign because "it's inefficient," when in reality it was just noise from a small sample.
Few junior marketers grasp this. Being able to say "it's too early to tell" is itself a skill — arguably a more advanced one than reading the metrics themselves. Forcing a conclusion out of numbers that aren't there yet is the riskiest move you can make. We covered how to judge whether your sample is big enough in our A/B testing post.
Try this today
Pick one campaign you're currently watching, and line up those four metrics in order: CTR → conversion rate → CPA → ROAS. Find the point where the red flag first appears.
That's what you should work on this week. Do just that, and you've already started treating metrics as a diagnostic tool instead of a pile of scattered numbers.
Wrap-up
Metrics are meant to be read, not memorized. Know the question each one answers, read all four together, and defer judgment when the numbers are thin. Get comfortable with just these three habits, and you can pick up every other metric one at a time, whenever you actually need it.
If you want to see the broader metric chain (all the way to installs, LTV, and CAC), continue on to our performance marketing metrics post.