CPI, CPA, ROAS, LTV, CAC… open a report and the acronyms pour out. You know what each one means, but "so what should I actually look at right now?" doesn't jump out at you. Today I'll show you how to read these metrics as one connected chain instead of memorizing them separately. Read them this way, and when a number spikes, you'll immediately know where to look.
If the number of metrics feels overwhelming, begin with only four: CTR, CVR, CPA, and ROAS. Once you know the question behind each number, the rest naturally join when you need to narrow a diagnosis.
Reading metrics one by one won't get you a diagnosis
Let's start with the most common mistake: reading each metric in isolation. You know what CPA is, you know what ROAS is — but when ROAS goes bad, you get stuck on "okay, so what do I fix first?"
There's a reason for that. There isn't just one thing that can hurt performance. Like every metric system, ad metrics are linked in one chain running from impressions all the way to long-term value. You have to look at the whole chain to see where the cause actually sits.
1. Metrics are one chain
Spend ad budget, and people come in, install or sign up, purchase (convert), generate revenue, and — if things go well — repurchase. Each stage has its own metric attached to it.
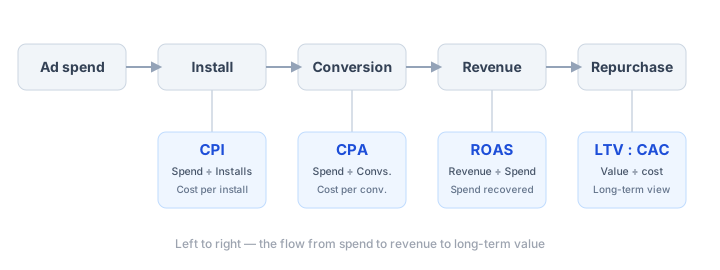
Lay it out left to right like this, and it becomes clear exactly which "link" each metric is watching. Let's go through them one at a time.
2. Each link answers a different question
Each metric answers a different question. Let's go through the definitions and examples briefly. (The numbers below are illustrative.)
- CPI (Cost Per Install): ad spend ÷ installs. It answers "how much did it cost to get one user to install?" It's generally the entry-point metric for app marketing. For example, spend 5 million won and get 5,000 installs, and CPI is 1,000 won.
- CPA (Cost Per Action): ad spend ÷ conversions. Here, "action" can be whatever you actually care about — sign-up, purchase, and so on. If installs keep growing but conversions don't, CPI can look great while CPA looks bad.
- ROAS (Return On Ad Spend): revenue ÷ ad spend, usually shown as a percentage. It tells you how much revenue one won of ad spend generated. For example, spend 5 million won and generate 15 million won in revenue, and ROAS is 300%.
- LTV : CAC: lifetime customer value divided by customer acquisition cost. It equals ROAS only when the same cohort, revenue basis, and cost scope define LTV as revenue/customer and CAC as ad spend/customer. LTV may use margin, and CAC may include sales or labor beyond ad spend. Check numerator and denominator definitions as well as the time horizon.
The first three (CPI, CPA, ROAS) look at this ad's efficiency and short-term profitability. LTV:CAC looks at whether "this business stays profitable in the long run." They're watching different time horizons.
Start with these four questions
Before memorizing every acronym, line up these four metrics. In day-to-day work, it is more useful to remember a metric as the question it asks than as a formula.
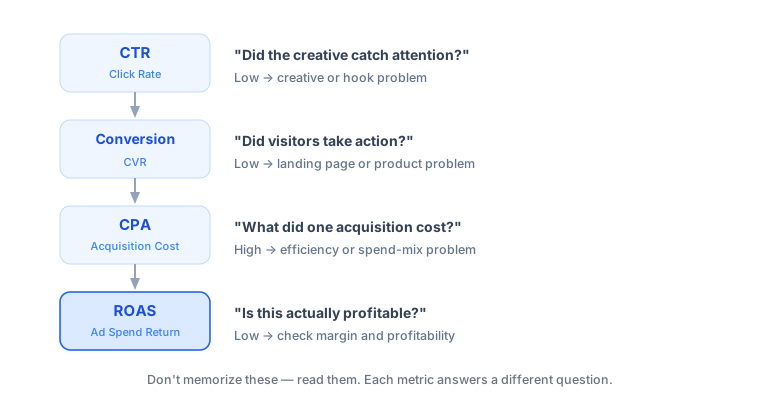
- CTR — Did the creative earn attention? When it is low, check the hook, thumbnail, copy, and the audience's first reaction. Compare with your own recent trend, not a universal benchmark.
- CVR — Did visitors take action? When it is low, inspect the landing page, offer, signup or checkout flow, and whether the ad makes the same promise. See the conversion funnel guide for the full workflow.
- CPA — What did one conversion cost? Do not replace creative just because blended CPA rose. The average can rise when more budget shifts to a more expensive channel even if channel efficiency did not change.
- ROAS — Is the outcome profitable? ROAS measures revenue, not margin or long-term repurchase. It can also include conversions that would have happened without advertising; when a firm answer matters, check incrementality measurement.
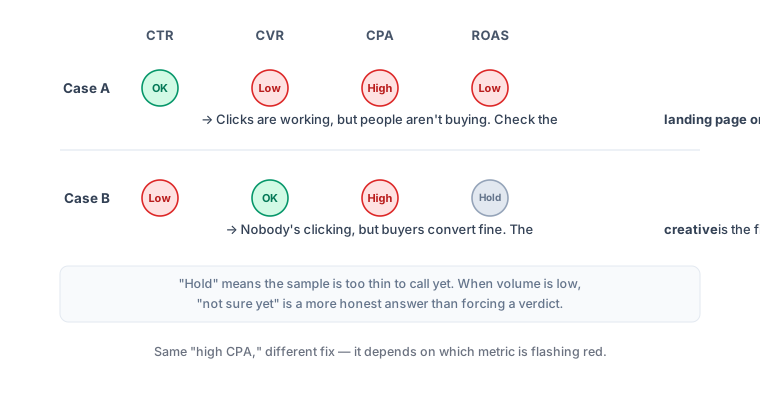
The same high CPA needs different action depending on the surrounding metrics. Low CTR with normal CVR points to creative or targeting; normal CTR with low CVR points to the landing page or product. When the sample is thin, the correct answer is "not enough evidence yet."
3. Connect CPM and CPC to the rest of the chain
CPM is spend per 1,000 impressions. With CTR expressed as a fraction, CPC = CPM ÷ (1,000 × CTR). For example, $10,000 for 5 million impressions gives CPM $2; 50,000 clicks give CTR 1% (0.01) and CPC $0.20. With 5,000 installs and 500 signups, CPI is $2 and CPA is $20. These illustrative identities require a consistent population, period, and attribution scope.
CPM, CTR, and conversion rates are arithmetic components of CPA. Use their changes to decide which breakdowns to inspect; they do not establish whether auctions, creative, targeting, or the landing page caused a change.
4. Read them as a chain to narrow the investigation
Here's where it gets genuinely useful. Line up every stage side by side, and you get a diagnosis.
Here's an example. CPA is low — meaning you're generating conversions cheaply. But ROAS isn't showing up.
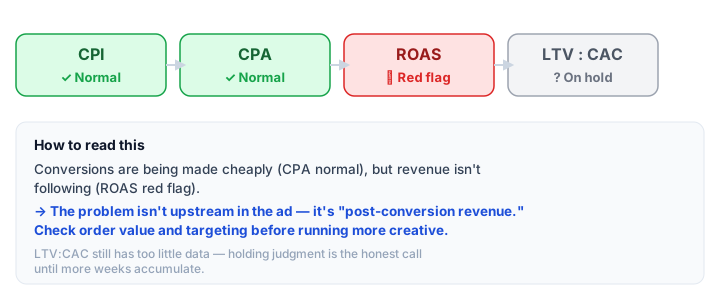
Low CPA alongside low ROAS is a reason to inspect order value and purchase conversion. Conversion definitions, revenue windows, delayed outcomes, audience mix, and missing tracking can produce the same pattern, so acquisition problems are not ruled out.
When CPA and ROAS look good but LTV:CAC is low, check repeat purchase and retention alongside cohort mix, margins, acquisition-cost scope, and lifetime-value assumptions. These three metrics alone cannot establish a retention problem.
Narrowing the cause down by asking "which link is flashing red" — that's the decisive difference from looking at metrics one at a time.
Try this today
As you think this through, a question will come up: the ad chain isn't just spend → install. In between there's impressions, there's clicks. When a metric moves, the problem could be a conversion rate shifting somewhere in the funnel, or impressions simply getting more expensive. So here's the one thing to try today: line up your daily cost and conversion metrics from top to bottom, and check how the price changes at each link of the chain, and how the conversion rate between links changes. Put cost metrics — CPC, CPI, CPA, CPP (cost per purchaser) — on top, showing whether they're rising or falling, and put conversion-rate metrics — CTR, install conversion, action conversion, purchase conversion — below, showing how they're moving. If the cost metrics above are rising while the conversion-rate metrics below are falling, you have narrowed a hypothesis to investigate. But what if the cost metrics are rising while the conversion-rate metrics are also rising or holding steady? Where's the problem then? Sit with that one.
One important note: don't judge a trend off too short a window. You need several weeks or months of trend to see the real pattern. Looking at daily data is fine, but day-of-week variance can be large enough that it's not always advisable — comparing day-of-week-adjusted variance would be a better bet.
Once you know which cell is red, marketing budget allocation covers moving budget on that reading, and CPM vs CPC vs CPI vs CPA covers the formulas behind each metric.
Wrap-up
The core idea is treating metrics as a connected chain. Each metric immediately affects — and is affected by — the metric right before and after it in the chain. You have to read the data accounting for the hidden conversion rates between links and the cost-per-impression (CPM) underneath every one of them (the answer to the question above) before the problem location becomes visible.
Upload a CSV to the free operations dashboard, confirm its mapping, and run analysis to compare the cost, conversion, and revenue metrics available in your input. Public Google Sheets can be imported where the feature is enabled; fetch the latest data with the refresh button. This is not private-sheet access or automatic synchronization. Uploaded CSVs are processed in the browser, without sending or storing source rows on a server. Check the local-device storage setting too.
And don't forget what we said earlier: a benchmark like LTV:CAC of 3:1 varies by industry. Your own data's trend is a far more accurate compass than someone else's benchmark.
If a number suddenly spikes somewhere in this chain, we've laid out where to look first, step by step, in our ad performance diagnosis.