Have you ever looked at landing page variant A against variant B and decided "hmm… B looks a bit better?" Run it for a few days, pick whichever has the higher conversion rate. But that could just be chance.
A/B testing is exactly the method for turning that "feeling" into a "number." Today let's look at how to run one properly, and one trap to watch for. By the end, you'll be a lot more careful about saying "this beat that."
Run it carelessly, and you'll mistake luck for skill
Let's start with the common mistake. Say you're trying to test creatives — you split creatives into one campaign and launch it. About three days in, B is pulling ahead of A. To save money, you quickly lock in B and end the test.
Sound familiar? Even stretching it to a week wouldn't change much. The real problem here is that conversion rate fluctuates by chance when the sample is small. Flip a coin ten times, and you might get heads seven times — that doesn't mean "this coin is good at landing heads."
Doing A/B testing properly means ruling out that chance and determining whether there's a "real" difference.
Here's what an A/B test looks like
The structure is simple. Randomly split your subjects roughly in half, show one half variant A and the other variant B, and compare conversion rate (or an absolute count).
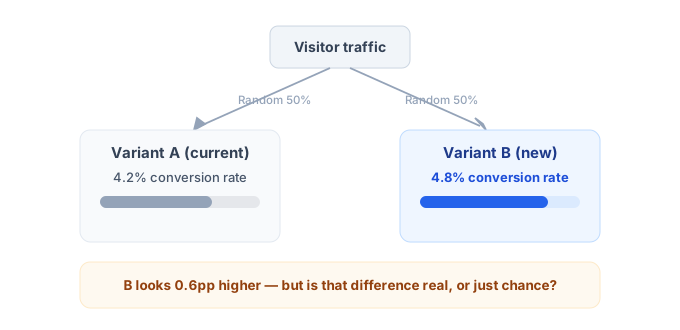
"Random" is the key word here. Random assignment balances other conditions in expectation. It does not guarantee balance in a realized sample or prevent assignment errors and cross-exposure. Check the design and tracking before interpreting the difference as an effect of the screen change. (This is the same logic as the holdout in the incrementality measurement post — you're just changing the screen instead of the ad.)
How do you calculate A/B test sample size?
Catching a small difference requires a larger sample. This is called statistical power — the probability of catching a real difference when one actually exists. The rule is to decide up front, before turning the test on, how many people (or how many weeks) you'll collect. That way you avoid the temptation to stop the moment it "looks like it's winning enough."
Sample size follows from four values: baseline conversion rate, minimum detectable effect, significance level, and power. Rather than solving it by hand each time, put those four into the A/B test sample size calculator to see the required audience and expected duration first.
What does calling a test on significance mean?
A p-value is the probability, under the no-difference hypothesis and test assumptions, of results at least as extreme as those observed. It is not the probability that the difference is chance or that B wins. Read the predeclared significance threshold alongside effect size, confidence intervals, practical relevance, and design validity.
The most common trap — early stopping (peeking)
This is the trap that catches the most people. You keep peeking at results mid-experiment, and the moment B pulls ahead, you go "got it!" and stop.
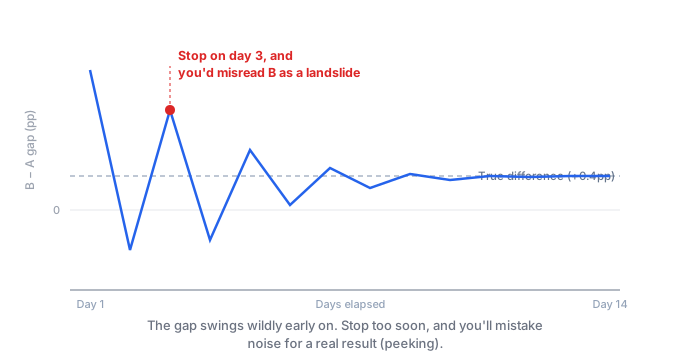
This is a fictional illustration, not a promise that an estimate reaches the true effect in 14 days. Repeatedly checking and stopping at significance changes the error rate of a fixed-sample test. Follow the preplanned stopping rule, or use a suitable sequential test when interim decisions are planned. Monitoring safety and assignment errors is different from selecting a winner.
A few other common traps worth a quick mention: laying out multiple metrics and cherry-picking whichever one happens to be "winning" (one of them is bound to win by chance), and traffic being too low to reach a verdict in the first place.
Try this today
Pick just one thing to test this week. Before you turn it on, write down exactly two things: (1) a single metric that defines success, and (2) how long you'll collect data for (sample size or time window). Monitor safety and assignment, but do not change the end date or success metric after seeing the outcome.
The trap of calling a cause from two metrics that merely moved together is covered in correlation vs causation.
Wrap-up
To recap: A/B testing turns a "feeling" into a "number." Randomize the split, decide your sample size up front, judge by significance, and don't peek in the middle.
If running a z-test or power calculation by hand every time is a hassle, upload your results CSV to our free A/B experiment analysis tool. It tells you whether the result is statistically significant, and whether your sample was even large enough to tell. Data is processed entirely in your browser and never leaves it.
One last thing: not reaching significance doesn't mean "B is the same as A." It can mean "we haven't seen enough to be sure yet." Hold judgment and inspect the confidence interval. If another experiment is warranted, preplan its sample, window, and stopping rule. Do not keep extending the existing test until it becomes significant.
References
- American Statistical Association statement on p-values — assumptions, interpretation, and limits for decisions.