You served a search ad to someone who searched your brand name. They clicked through, and they purchased. Your report shows 'ROAS 800%.' Feels good, right?
But wait — wouldn't those people have landed on your site anyway, even without the ad? They already searched your brand name. If so, that conversion wasn't "created" by the ad — it was "picked up" by it. Today let's look at how to tell these two apart: incrementality measurement, which isolates only the performance an ad actually created. By the end, you won't be able to take dashboard ROAS at face value the way you used to. And that skepticism is exactly what leads to richer analysis.
Attribution splits credit; incrementality measures the real effect
Let's start by distinguishing two concepts people frequently confuse.
Attribution (credit allocation) takes a conversion that has already happened and splits "which channel gets the credit for this." Whether it's last-click or first-click, it's the job of assigning credit that's already been earned to a channel. But there's one question it can't answer:
"What would have happened if we hadn't run that ad?"
This is called the counterfactual (a hypothetical that never actually happened). Incrementality is exactly this question. As a formula:
Incremental conversions = (conversions with the ad) − (conversions without the ad)
A significant chunk of the conversions showing up in your dashboard may be "baseline" — conversions that would have happened even without the ad. Strip out that baseline, and what's left is the pure incremental share.
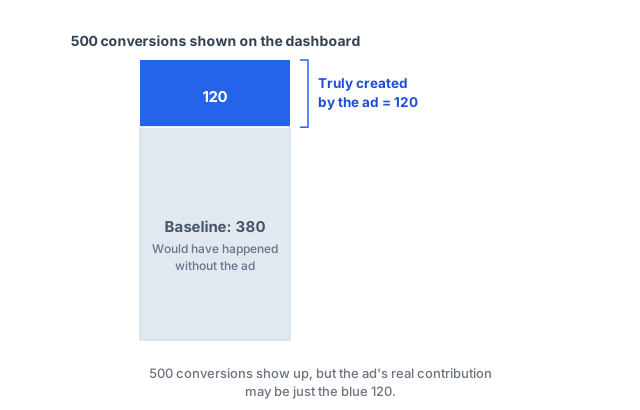
Just like this image. Even if marketing shows 500 conversions, the ad may have genuinely created only the 120 on top. The other 380 were customers who were coming anyway. The problem is the dashboard doesn't separate the two — it shows all 500 as credit for the ad.
So how do you actually measure incrementality — three holdout experiment designs
Even for a newly launched ad, a simple before/after difference does not identify incrementality. You need a design that separates simultaneous demand, promotion, and tracking changes. The following methods include randomized holdouts and quasi-experiments requiring additional assumptions; their names alone do not establish validity.
The core idea is one thing: compare a group that saw the ad against a group that didn't. Observation alone can't tell you the counterfactual — you have to actually construct the world where they didn't see it. There are broadly three methods used in practice.
① Control-group holdout — the cleanest method
Split users into two groups. Show one group the ad (exposed group), and deliberately withhold it from the other (control group, or holdout). Then compare the conversion rate difference between the two.
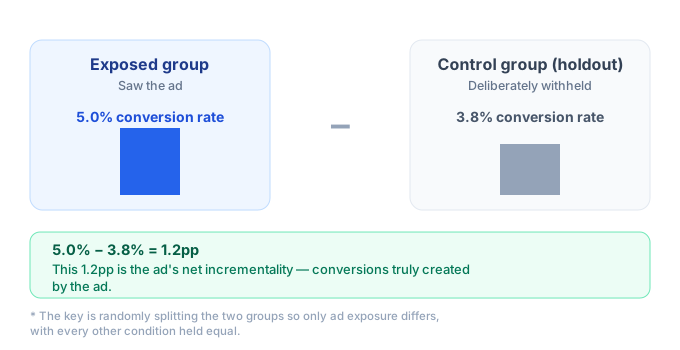
Randomize assignment in advance and compare by assigned unit. Selecting only people who actually saw an ad can introduce selection bias. Check allocation, cross-exposure, missing tracking, and duplicate units, then interpret the conversion difference and interval under a valid design. Platform Conversion Lift also has product-specific design and eligibility conditions.
A platform holdout estimates effects for the campaigns, population, and period included in that study. It cannot automatically be generalized to all advertising. Suitability for new or existing users depends on the study population and measurement design.
② Turn something new ON
Turn on a region or channel that wasn't previously running, and compare it against a similar region that stays off. This is often used when it's hard to split by individual user, or when you want to see the pure incremental lift from a marketing channel (a geo experiment). For example, you'd turn on a new campaign in Seoul and Gyeonggi, and leave a demographically and behaviorally similar region untouched to compare the two. In Europe, this is sometimes done by comparing similar countries; in the US, grouping by state tends to be easier. The important thing here is that the exposed and control groups need similar underlying trends. In Korea, users are so heavily concentrated in Seoul and Gyeonggi that finer targeting is needed — which inevitably means more data-prep resources and some loss of marketing efficiency. So the true last resort is method 3.
③ Turn something OFF + Difference-in-Differences (DiD)
Turn off a campaign that's been running well, and see how much performance drops. It's simpler than it sounds, but powerful — you can see the effect in both directions: how much it drops when you turn it off, and how much it recovers when you turn it back on.
That said, a naive before/after comparison is risky. Other changes — seasonality, promotions — can get mixed in during that window. "It dropped after we turned it off" might actually just be an off-season effect.
Difference-in-Differences (DiD) subtracts the comparison group’s change from the intervention group’s change. It requires parallel counterfactual trends and attention to differential concurrent shocks, spillovers, and anticipation. Similar pretrends do not prove these assumptions. If they fail, the difference does not isolate the effect of switching ads off.
If setting this up is too much of a hassle, you can instead use regression to extract seasonality, pre-compute an expected-performance forecast for "if things had stayed the same," and then calculate how far actual performance dropped below that forecast after turning the campaign off. This does require being able to run a regression, and having some confidence in that regression's output.
Reading the results — two things to watch for
Switching to incremental terms can make performance drop sharply
At the same spend, incremental revenue below attributed revenue gives a lower iROAS. But positive incremental conversions below attributed conversions give a higher iCPA (spend ÷ incremental conversions). For example, $1,000 spend, 100 attributed conversions, and 25 incremental conversions give CPA $10 and iCPA $40. Zero or negative incremental conversions, or an interval crossing zero, do not support a stable positive cost metric. Attributed and incremental totals need not always have the same ordering across measurement scopes.
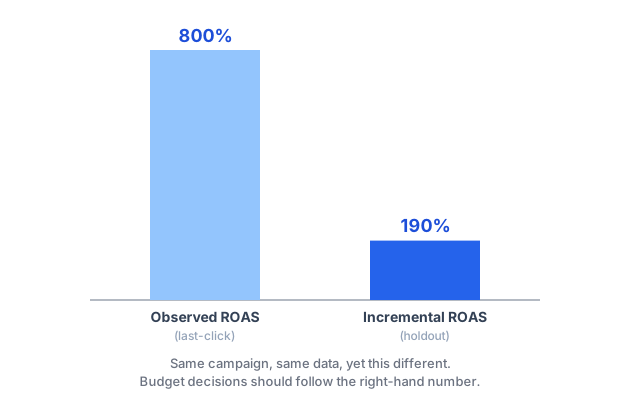
This isn't meant to scare you with the numbers — quite the opposite. It's exactly this right-hand number that lets you actually direct budget toward what's genuinely efficient. And that can meaningfully change the direction of your business.
"Not statistically significant" doesn't mean "no effect"
Incrementality is usually a small difference, so with a small sample it often doesn't register statistically. When a result comes back "not significant," that means "we haven't seen enough to be sure yet" — not "there's no effect." Conflating the two leads you to prematurely kill a perfectly good channel.
At the planned readout, inspect the interval and practical relevance. Preplan a new sample, window, and stopping rule for further testing; if the effect remains indistinguishable, "hold judgment" is often the right answer. There are methods (like marketing mix modeling) that use observational data to quickly estimate direction, but the principle is that confirmation comes from a holdout experiment. "Association" and "causation" are different things.
Try this today
Pick just one campaign that seems most suspicious. Brand search or retargeting is usually the top candidate — since it's served to people who already know you, incrementality tends to be low. They may well have come in anyway. Or is there a channel where you kept raising budget and conversions kept climbing, but you never actually saw business growth from it? If so, that's your suspect. Don't try to validate everything at once — just one campaign is enough to start.
For the step-by-step of designing a holdout and reading its result, see advertising uplift measurement; when the change sits outside the ad — a screen or a creative — A/B testing applies the same logic.
Wrap-up
To recap: attribution splits credit, incrementality measures the real effect — and the real effect comes from experiments, not observation.
If manually comparing exposed-group and control-group numbers and checking significance after running a holdout sounds like a hassle, try my holdout test tool. It calculates net incrementality and statistical significance across all three methods — control-group holdout, turn-ON, and turn-OFF (DiD). Uploaded data is processed entirely in your browser and never leaves it, without sending or storing uploaded source rows on a server.
One last thing, for real this time. Incrementality measurement isn't about talking down advertising — it's the opposite. You need a clear view of which campaigns are truly creating performance so you can direct budget there. Stripping out inflated numbers is, in the end, about investing more in what actually works. So don't hesitate — let's take an honest look at what each campaign really looks like underneath.