When you're putting together a marketing plan, there's one approach that's more common than any other: "put more into the channel that had good ROAS last time, and cut the one that didn't." At first glance it seems reasonable. But this approach can actually hurt performance. Today let's look at why — and by the end, you'll look at "allocation by efficiency" a little differently.
Why "allocation by efficiency" is a trap
There's one core issue: last month's scorecard is a result that happened at last month's spend level.
Say channel A had the best ROAS last month. So you dump this month's budget into A. But the reason A performed well last month is that it performed well at last month's budget level. What happens when you pour more money in? Performance ads are, by nature, most efficient at an appropriate level of spend. Early on, ads reach the people most likely to take your target action. But the users left outside your current reach are relatively more expensive than the ones you got when you were spending less. So the efficiency of the extra budget you pour into channel A ends up landing well below last month's average.
In other words, the intuition of "put more into whatever worked" misses the fact that a channel gets more expensive the more you pour into it. That's the thing to catch.
1. "Average efficiency" and "the efficiency of the next won" are different things
The number you should be looking at for budget allocation isn't last month's average CPA. It's the CPA of the next won you spend.
Let's separate the two:
- Average CPA: money spent so far ÷ conversions generated so far. It's a historical scorecard.
- Marginal CPA: the CPA of the conversions generated by the next increment of budget (say, the next 1 million won) you add. It's the number you actually need for a forward-looking decision. (This is sometimes called Marginal CPA.)
Budget allocation is about deciding the future, not the past. So what you should look at isn't just last month's average — it's the value of "the next won." Economists call this marginal utility (the extra effect the next won produces). The term sounds complicated, but the idea is simple: "if I put in another 1 million won right now, how much more do I actually get?"
2. Even good channels get more expensive the more you pour in (diminishing returns)
Almost every marketing channel sees conversions grow more slowly past a certain point as you increase spend. (There are occasional exceptions, and marketers tend to run campaigns hoping for a miracle like that — though when that happens, suspecting a cannibalization effect is a chronic marketer's habit.) Plotted out, this looks like a curve that rises steeply at first and then flattens. This curve is called the response curve.
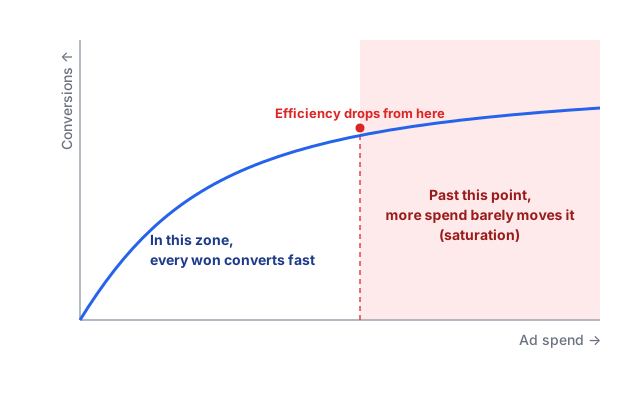
A flattening section of the curve is a signal that a channel has become saturated. Pour more money in there, and conversions barely tick up while CPA climbs. Conversely, a channel whose curve is still steep still has room to grow.
Here's the key point: a channel with a lower average CPA doesn't necessarily have more room. If a channel's already been pushed into its saturation zone, its surface-level average can look good while "the next won" is actually expensive.
3. There's exactly one rule — equalize "marginal efficiency" across channels
So how should you split the budget? There's one rule.
Move budget until each channel's "marginal CPA" converges to roughly the same level.
The numbers make it click. Here's an example:
- Channel A: average CPA looks cheap at 8,000 won. But it's already been pushed hard, so the marginal CPA on the next 1 million won is 15,000 won.
- Channel B: average CPA looks expensive at 12,000 won. But it still has room, so the marginal CPA on the next 1 million won is 13,000 won.
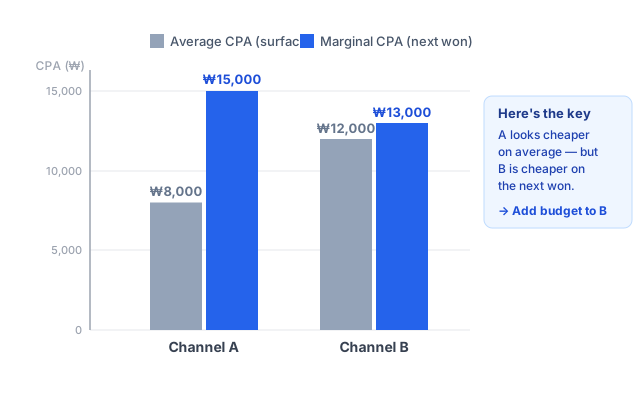
Looking only at averages, A looks cheaper, so you'd want to put more into A. But look at "the next won," and B is actually cheaper. So putting extra budget into B produces a bigger increase in total conversions than putting it into A. This happens because each channel hits its marginal efficiency point at a different level, and each is operating at a different spend scale to begin with. Keep shifting budget from the channel with the higher marginal CPA to the one with the lower marginal CPA, and at some point the two channels' marginal CPAs converge — and that point is your data-driven optimal allocation.
It's an old idea from economics, but it maps directly onto channel budget allocation. The core of budget allocation isn't "dump it all into whatever looks cheapest" — it's "equalize the value of the next won across channels." And the reason that matters comes down to differences in spend scale and differences in diminishing returns across channels.
Try this today
You don't need a fancy model to try this today — there are two things you can do right now.
One, isolate the CPA of each channel's "recent increase" segment. If there's a period in the last few weeks — or in past data — where you increased a channel's budget, calculate the CPA of just the conversions that came from that increase. For example, if a channel that used to spend 1 million won was bumped to 2 million won, and conversions went from 100 to 170, the marginal CPA on that extra 1 million won is roughly 14,285 won. That's a rough sense of marginal CPA. If it's noticeably higher than the average CPA, that channel is likely nearing saturation — go looking for another channel.
Two, don't shift a large amount all at once. Marginal efficiency is ultimately a function of how much budget you add or remove. Even if a channel's marginal efficiency looks good, shifting too much into it too fast can bring on a faster efficiency decline. Remember that the slope of marginal efficiency differs by channel and by campaign. Shift budget gradually and observe for about two weeks each time — confirm that efficiency is actually improving, and check whether you're converging toward the marginal-efficiency point you identified.
Wrap-up
Here's the summary: going forward, allocate budget based on "the efficiency of the next won," not last month's average. Keep in mind that even good channels get more expensive as spend increases, and keep an eye on each channel's spend-to-efficiency slope. The goal now is finding the point where marginal efficiency converges across channels.
The catch is that plotting a response curve and estimating marginal efficiency by hand for every channel is a real hassle — fitting curves in Excel is its own chore. So we built something so you don't have to do this math every time. Upload just your channel-level spend and conversion CSV to the budget allocation tool. It estimates a marginal-utility curve for every channel and produces an optimal allocation plan. (In practice, the channel with the best average efficiency is often also the one with the best marginal efficiency — we've built in an efficiency-based allocation view for that case too.) Uploaded data is processed entirely in your browser and never sent to a server, so there's no risk in putting your media spend or revenue numbers anywhere external. No sign-up or payment required — just upload a CSV and get started.
One last important point: an allocation plan is ultimately a data-driven "estimate." Rather than moving everything at once based on the output, we recommend shifting gradually and confirming with actual performance, as described above.