When CPA spikes, the reflex is to blame the creative. "Maybe it's gotten stale — time to make something new." But more often than you'd think, the creative is perfectly fine and CPA still climbs. Fix the wrong thing and you've just burned time. Today, let's split a CPA increase into two pieces so you can find out where the real problem actually is.
A rising CPA is usually two different things tangled together
When your overall CPA goes up, there are two very different things mixed into that number. Miss the split, and you end up fixing the wrong one.
Mix effect — each channel's own CPA hasn't moved, but budget share has shifted toward the pricier channel, so the blended average rises. The allocation changed; no channel actually got worse.
Efficiency effect — a channel's own CPA genuinely got worse. This is a real efficiency problem: creative, saturation, audience, and so on.
Let's make this concrete with numbers. Say Channel A's CPA is ₩8,000 and Channel B's is ₩12,000. Last month, 70% of conversions came from cheap A and 30% from pricier B. This month it's split 50/50.
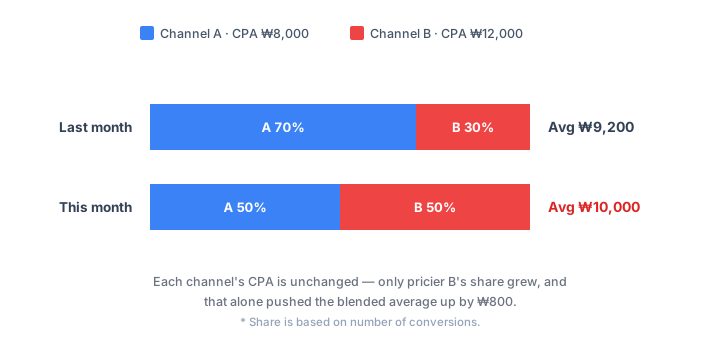
Each channel's CPA is still ₩8,000 and ₩12,000 — nothing got worse. But because pricier B's share grew, the blended average CPA rose from ₩9,200 to ₩10,000. That's the mix effect. If you tear apart your creative here, it accomplishes nothing — the problem was never the creative, it was the allocation.
Why skipping the split wastes effort — the fixes are opposites
If it's a mix effect and you rebuild your creative anyway, you burn time and money for nothing — the channel was fine all along. Flip it around: if it's a genuine efficiency effect and you only fiddle with budget allocation, the root cause never gets addressed.
That's why order matters. Split first, then treat. Get that order right and you cut out most of the wasted motion.
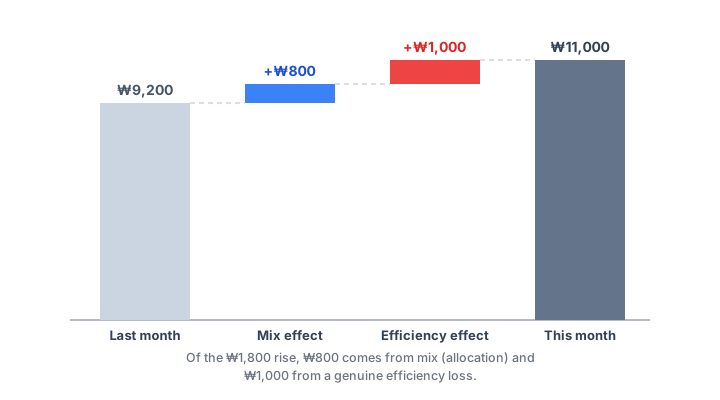
Splitting the increase into two pieces like this tells you where to put your energy. In this example, of the ₩1,800 rise, ₩800 comes from allocation and ₩1,000 from real efficiency loss. You probably need to address both — but knowing the split tells you which to prioritize.
If it's really an efficiency effect, the culprit is usually one of three things
Say you split it out and efficiency effect turns out to be the bigger piece. Now you need to look inside the channel. The usual suspects are three.
Saturation. You've poured too much into the same channel and its marginal CPA has risen. A wide gap between "marginal CPA ÷ average CPA" is the saturation signal. The fix here is to stop scaling up.
Creative fatigue. The same creative has run too long and CTR/conversion rate have dropped. This is the one case where blaming the creative is actually correct — and where you do need to swap it out.
Audience exhaustion. You've already captured everyone likely to respond well, and only pricier remaining users are left. Widen your targeting or find a new audience.
What this split doesn't tell you: why the mix changed
Let's be honest about something here. Splitting into mix effect and efficiency effect is a contribution decomposition — it calculates "how much is due to what." It is not a causal verdict on "why this happened."
For example, this decomposition won't tell you why Channel B's share grew. Maybe an auto-bidding algorithm pushed it there. Maybe someone manually shifted budget. You'd have to check that separately. Observational data only gets you "here's how it splits" — confirming "this is why CPA rose" requires an experiment. Holding that line is where trustworthy data use starts. We go deeper on the difference between association and causation in this post.
One more note: here we split CPA at the channel level, but working backward from total revenue to each channel's contribution is what marketing mix modeling does. Same family of "contribution decomposition," so the two are worth reading together.
Try this today
Split this month's CPA increase by hand, just once. The method is simple.
- Keep each channel's CPA at this month's actual value.
- Swap in last month's conversion mix and recalculate the blended average CPA.
- The gap between that recalculated value and last month's actual average CPA is the efficiency effect — the mix stayed fixed, only CPA moved. Then subtract that from this month's actual average CPA; the remainder is the mix effect.
Just two numbers, and you already know your direction. If mix dominates, start with allocation. If efficiency dominates, start inside the channel.
Wrapping up
CPA moves because allocation and efficiency are tangled together. So the first step in lowering it isn't touching the creative — it's splitting the increase into mix and efficiency. Know the cause, and the fix follows.
If doing this residual-free decomposition by hand every month is a hassle, try uploading a CSV to our free campaign performance variance tool. It automatically splits your CPA increase into mix effect and efficiency effect. Everything you upload is processed in your browser only — nothing gets sent to a server.
If ROAS wobbled alongside CPA, pair this with our ROAS improvement post for a clearer picture — the two metrics are really the same allocation-and-efficiency problem viewed from different angles.