Ever raised budget on brand search because its ROAS looked outstanding — and watched total revenue stay flat? Last-click praises only the channel that stood last in the journey; the credit earned by channels that created demand upstream all flows to the final click. When one person sees dozens of ads across channels in a single day, judging performance with last-touch attribution alone stops making sense. Multi-touch attribution does not always deliver a clear answer either.
That's why Marketing Mix Modeling (MMM) is having a resurgence. Today I'll lay out plainly what it is, what it answers, and how far you should trust it. Oh, and I'll also show you how to actually do it.
MMM "reverse-engineers" the outcome you're aiming for
MMM doesn't track individuals. Instead, it works backward from the big picture.
Put simply, MMM takes "how much did we spend on each channel per week over the last year, and what was revenue each of those weeks?" and uses a statistical model to estimate revenue = baseline + channel A contribution + channel B contribution + external factors. The tool it uses here is regression (a statistical method for finding an equation that explains an outcome through multiple explanatory variables). It pulls out each variable's model-based contribution as a number. Put even more simply: it's statistically slicing up the whole "outcome" cake you defined, showing how much each ingredient contributed.
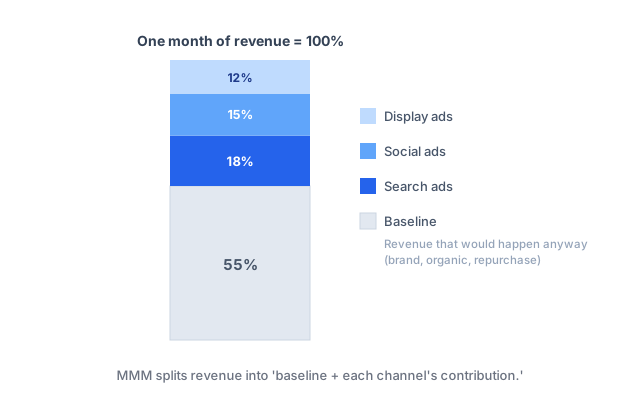
In this example, the outcome is set to "revenue." That's how it slices revenue up. Here, baseline is the share that would show up even without any advertising (brand awareness, organic traffic, repurchases, and the like) — the same baseline concept discussed in the incrementality measurement post. MMM draws that out across every channel at once.
The data you need is your "outcome" data plus each channel's spend and impression volume — since it doesn't rely on individual-level data, it depends less on personal identifiers. Changes in aggregate measurement, missing conversions, or definitions can still affect it. And because it doesn't hand credit to the last touch, it lets you see how much your actual budget spend impacted the business, rather than overweighting whichever touchpoint happened to come last. That's why MMM is back in the spotlight these days.
Two things you absolutely have to get right
Just running a naive regression of outcome on spend will give you the wrong answer. Advertising has two tricky properties.
Adstock — ad effects don't end in a day
An ad you saw today doesn't only produce its effect today. It can lead to a purchase days, or even weeks, later. This carryover effect is called adstock (the effect that lingers after you turn the ad off).
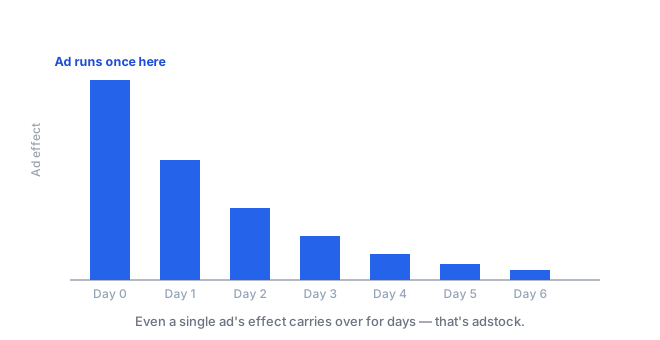
Ignore this, and you'll attribute delayed conversions to the wrong moment and the wrong channel — distorting contribution.
Saturation — the more budget you pour in, the less efficient it gets
Nearly every channel sees its marginal conversion growth slow down as you increase spend (diminishing returns). MMM estimates this saturation curve to answer "can this channel take more budget?" It's the same principle as the response curve covered in the marketing budget allocation post — MMM just estimates that curve for every channel at once.
So what does MMM actually tell you?
To sum up, it answers three things.
Model-based channel contribution under explicit assumptions. This gives a different view from last-click attribution; it does not automatically reveal true causal contribution or repair attribution errors.
Next month's forecast. It projects roughly how much revenue you'd generate if you kept the current allocation. This comes from the nature of regression — once you have the fitted coefficients, forecasting follows naturally.
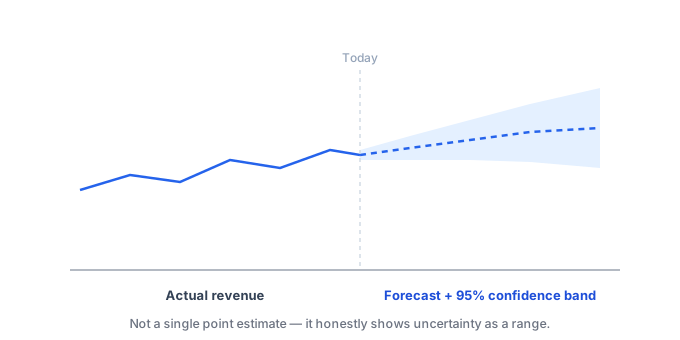
The illustrated 95% band is conceptual, not this tool’s actual output or validated future coverage. Confidence, prediction, and posterior intervals have different meanings; check the type and assumptions. Read the tool’s stated interval level alongside time-ordered validation. Training reference-range coverage does not validate coverage on independent future outcomes.
Three, possible cannibalization hypotheses. Patterns between channels require a separate comparison design before being interpreted as causal displacement. A common example: brand search ads eating organic traffic that would have come in for free anyway.
How far should you trust it — MMM's limits
This is the most important part. Because MMM runs on observational data, what comes out is an "association" estimate. It can say "this channel is associated with revenue by this much" — it can't nail down "this channel created this much revenue."
There are traps too. The classic one is multicollinearity (when several channels are always scaled up and down together, the model struggles to tell whose contribution is whose). Short data windows make this worse. In practice, marketers often bundle several actions into the same day or week, which makes it hard to tell which action actually moved the needle.
So the principle is this: use MMM to set overall direction, and confirm actual results through experiments. If MMM says "social's contribution is bigger than expected," you test that by scaling up spend and checking the result. Conversely, if it says "this channel looks like it's cannibalizing," you run a holdout test. (Holdouts are covered in detail in the incrementality measurement post.) Think of experiments and MMM as a pair, not competitors.
Before fitting the model, use the MMM multicollinearity checklist to check whether channel spending patterns can be distinguished.
Try this today
MMM needs data before it needs a model. Today's task is "gathering ingredients." Collect the following into one sheet, weekly:
- Ad spend by channel (weekly)
- Revenue (weekly)
- External factors (promotions, seasonality, price changes, major events)
Fifty-two weeks is an illustrative annual window, not a universal sufficiency threshold. Check channel count, independent spend variation, repeated seasonality, external factors, and missing data. In channel contribution analysis, review input conditions, identification, and error against a simple baseline on the same chronological windows before deciding.
Wrap-up
To recap: MMM doesn't track individuals — it reverse-engineers total outcome into "baseline + channel contribution." Getting adstock and per-channel saturation right is what makes the measurement sound, and the result is a compass pointing you in a direction, not a final verdict.
Calculating this regression, adstock, saturation, and confidence band by hand is a hassle, on top of an already-annoying data prep step. So if you have weekly data, you can run all of it at once in the MMM analysis tab mentioned above. Uploaded data is processed entirely in your browser and never leaves it. (User privacy matters these days, doesn't it!)
And don't forget: MMM narrows hypotheses, and experiments test them under valid design conditions. Use both together, and you move budget based on evidence instead of gut feel. (And statistics and math are, honestly, the most powerful weapon you have for persuasion!)