Screenshots changed, and two weeks later conversion is up. Was it the screenshots? If ad spend also grew and the season turned in those same two weeks, the honest answer is that you do not know.
Decomposing store conversion narrows where to look, but it does not prove cause. Confirming that a change worked takes an experiment — and both stores provide one for free.
Why before-and-after fails
Before-and-after compares "before the change" against "after it". The problem is that time passed in between.
- Did ad spend and channel mix hold?
- Was the seasonal and day-of-week composition the same?
- Were there app updates, ratings shifts, competitor promotions?
- Did the traffic source composition stay put?
Any one of those moving lands in the screenshot's column. The last one catches people most often, because a shift in source composition moves the blended rate even when every per-source rate holds steady.
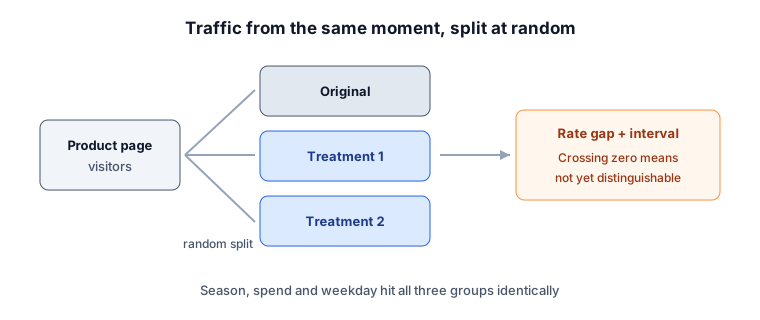
Store experiments reduce this through random assignment at the same moment. Conditions balance in expectation; verify actual allocation and measurement rather than assuming perfect equality.
The two stores are built differently
Apple and Google measure differently, so their results do not belong on the same scale.
Apple PPO (Product Page Optimization). Up to three treatments run alongside the original, for up to 90 days, covering icon, screenshots and preview videos. Testing the icon actually changes the app icon on device home screens, so icon tests deserve more caution than the rest.
Google Play listing experiments. Icon, screenshots and preview video plus short and full descriptions. Experiments support default and custom listings. Localized experiments and country targeting for custom listings are distinct settings; check both the listing and language selected.
Traffic allocation, win criteria and statistical treatment all differ. "It won on Apple, so ship it on Play" is a hypothesis, not evidence — run it on both.
Change one thing
If a variant that changed icon, screenshots and description together wins, you do not know what won — and you cannot reproduce it next time.
One change per test is the principle, though limited experiment slots force compromises in practice. When you have to bundle, record exactly which elements changed and follow up by re-testing the winner element by element.
Duration and stop conditions
Plan duration from sample needs, the improvement worth detecting, and business cycles. A week is seven days; two weeks is not a universal floor. Check the platform’s duration estimate and decision criteria.
More important than duration is fixing the stop condition before you launch. Watching the dashboard daily and stopping when a variant pulls ahead accumulates chances to stop on a random peak, which inflates how often you declare a winner that is not real.
Write these two lines down at the start.
- When will this stop (a date, or a minimum conversion count)?
- How large does the gap need to be before we adopt?
Reading the result
Start with the interval. An interval crossing zero means "not yet distinguishable", not "no effect". Those are different states — more data might still separate them.
Read the lift in absolute terms too. Going from 30% to 31% is a 3.3% relative improvement but 1pp absolute: 100 extra installs per 10,000 views. Whether that size justifies the cost of shipping it is the actual decision.
Separate exposure surfaces from outcome metrics. Apple PPO treatments may appear in search results and the Today, Games and Apps tabs, so search response is not entirely outside the test. A download conversion improvement does not establish a gain in long-term retention or revenue.
Carrying results into operations
After shipping a winner, confirm with store conversion analysis that per-source conversion actually rose. Check whether the experiment and operational report use the same exposure and conversion denominators, and track changes in source composition.
If per-source rates held but the headline number got worse, mix can explain the aggregate conversion difference when source definitions and denominators are consistent. Whether the experimental effect persists still needs checking. Separating the two keeps a real experimental gain from disappearing into operational noise.
Try this today
- Find the oldest element on your store page. It is usually the first screenshot.
- Pick exactly one variant, and write the end date and adoption threshold down before launching.
- Note the start date on a calendar — it becomes the reference point when you read the trend later.
Limits of this approach
Random assignment makes store experiments one of the few ASO tools capable of causal inference. That does not make them universal.
PPO exposure does not stop at the product page. Its result alone does not establish causal effects on keyword rank or overall business performance. An app update or a ratings swing during the test hits both groups, but it can still change the size of the effect you measure.
And a winner does not win forever. Season, competitive context and traffic composition can flip the verdict. Rather than holding a past winner indefinitely on no evidence, re-validate periodically.
Official references: Apple PPO · Google Play experiments.