The short version (3 lines)
- Whether you are increasing, reallocating, or cutting budget, start with marginal ROAS or CPA over the incremental or removed spend range.
- Add where marginal efficiency is highest, shift from low to high, cut where it's lowest. Same curve, you're just pushing it in a different direction.
- A response curve does not guarantee the future. Scaling and cutting use the same decision logic, but they may not behave like mirror images in live operations.
Why ranking by average efficiency misleads you
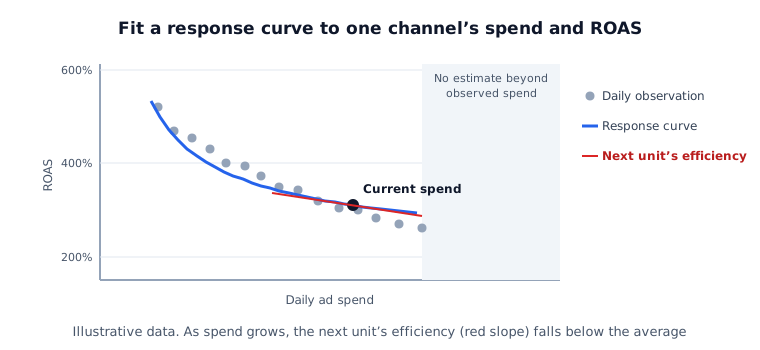
Ranking channels only by average ROAS (or average CPA) can keep pouring spend into a saturated winner while starving a channel with headroom. What matters is efficiency over the incremental spend range = marginal efficiency. Google Meridian likewise separates ROI as average return at historical spend from mROI as the return on incremental spend at the current level.
In this article, marginal CPA is an operating definition that applies the same idea in cost space: change in spend ÷ change in conversions over an incremental range. It is not a Google Meridian term; the official source above supports the distinction between mROI and the response curve.
Treat equalized marginal efficiency as an allocation candidate only when the response curve is reliable within the observed range, KPI and cost scope are comparable, and channel constraints such as minimum and maximum spend are represented. Without those conditions, a mathematical optimum is not an operating answer.
One metric solves all three directions
Scaling up — add only where marginal ROAS is above your target line
Headroom means the current estimate still places the channel before saturation. Prioritize channels whose next-dollar ROAS clears the target line; below the line, the expected incremental return misses the requirement.
So why can a winning campaign worsen after scaling? It may have entered the flat part of the response curve, while auction conditions, audience, creative, or conversion maturity changed at the same time. Do not force those possibilities into one domino story. There is also no universal 20–30% scaling rule. Choose a small testable step from the observed spend range, current platform guidance, conversion volume, and acceptable volatility; review the result before the next increase.
Reallocating — move until marginal efficiency equalizes
With a fixed total, pull from the low-marginal channel and push to the high-marginal one. Treat the point where they converge as a candidate only when KPIs and estimation conditions are comparable and channel constraints are represented. Meridian also separates fixed-budget, target-ROI, and target-mROI optimization scenarios.
Cutting — remove the lowest-marginal dollar first
"Told to cut 30%—what goes first?" starts on the same curve. Instead of an even trim, build a candidate cut order ranked by marginal (incremental) contribution. Then apply operating constraints: minimum delivery, measurement coverage, the role of brand or always-on activity, and reversibility.
Why a response curve cannot make scaling and cutting mirror images
A response curve estimates a relationship over the observed period and spend range. Future auctions, audiences, creative, and media prices are not held constant. Meridian's future scenario-planning guidance explicitly asks for assumptions about period, geography, execution pattern, media cost, and KPI value. Before a cut, treat these as model-external checks:
- Delivery and readaptation — a large budget change can create delivery and performance volatility in some automated campaigns. It does not mean every budget cut universally resets learning.
- Thinner signal and operating constraints — lower spend can reduce conversions and delivery opportunities, making the estimate less stable. Set minimum operating conditions by channel.
- A different future state — when spend returns, auctions, targeting, creative, and demand may have changed, so historical performance is not guaranteed to return exactly.
Simulate all three with the tool
The Budget Allocation Simulator compares where to add and where to pull using marginal efficiency. Example data explains the interface; use your own CSV, observed range, and constraints for an actual budget decision.
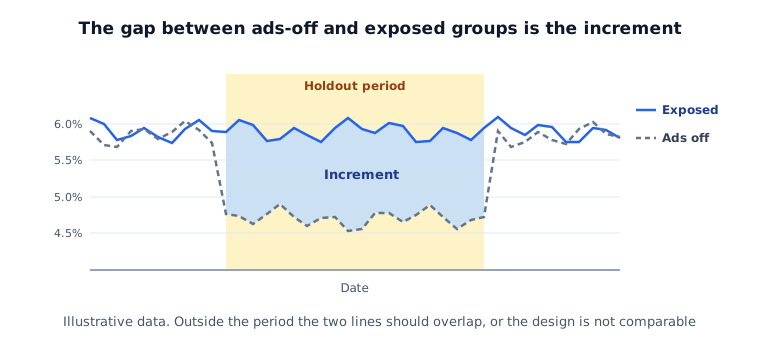
⚠️ One honest caveat. This simulator estimates budget moves from relationships in the observed historical range. It does not model how auctions, creative, or demand may change after the move, nor whether historical performance will return. When the causal impact of a cut matters, pair the reallocation result with Incrementality Analysis to test "how much actually disappears if I pull this channel."
To decide how far one channel can scale, ad budget scaling limits covers setting a ceiling with marginal CPA; to check whether the budget is affordable at all, see the LTV:CAC ratio.
Try it on your own data
No signup · your CSV is processed in the browser · no server storage.
👉 Open the Budget Allocation Simulator
Related
- Tools: Campaign Saturation Diagnosis — is there headroom to scale · Creative Fatigue Analysis — check fatigue signals during operation
- Glossary: Marginal CPA · Marginal ROAS · response curve — the marginal-metrics hub