Plenty of teams answer "can we keep spending on this channel?" with LTV:CAC. But before you relax at a ratio above 3:1, check whether the number was computed right. Depending on what you took as the denominator, and whether you used revenue or margin, the same data can flip the conclusion. Here's the math, then the three spots people most often get wrong.
Start with CAC
Customer Acquisition Cost (CAC) is allocated acquisition cost divided by distinct new customers within the same scope. Here a customer means a first-time paying customer. Label cost per install as CPI and cost per signup as signup CPA separately.
| Scope | Definition to align |
|---|---|
| Acquisition cost | Ad spend only, or allocated sales and production costs too? |
| New customers | Distinct first-time paying customers, without repeat orders |
| Cohort | LTV from that same original customer population |
| Observation window | Observed D30 values separate from predicted D180 values |
Repeat orders and install counts are different denominators. If acquisition takes much longer than a month, disclose the approximation in dividing this month’s spend by this month’s new customers.
LTV is an estimate
LTV (Lifetime Value) is the total a customer earns you until they churn. The catch is you have to look into the future — so it's an estimate.
The simplest form:
Revenue-based LTV ≈ monthly revenue per customer × average lifetime in months
This simplification assumes stable monthly revenue. More generally, combine period-specific survival and revenue or margin, separating observed value from future estimates.
Lifespan comes from the retention curve. Better retention means longer stays and larger LTV — which is why cohort analysis and LTV are a set.
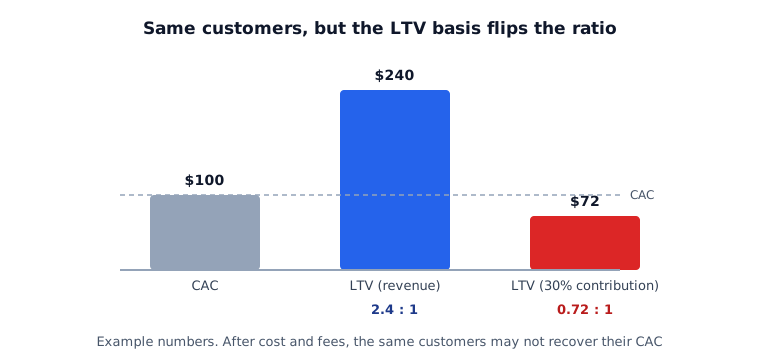
A quick example (numbers illustrative). Spend $50,000 to acquire 500 paying customers → CAC $100. If they spend $20/month on average and stay 12 months, LTV is $240. So LTV:CAC = 240 ÷ 100 = 2.4:1.
More rigorously you plot cumulative revenue curves per cohort and extrapolate the future, but early on the data is shallow and uncertain. Keep in mind early-cohort LTV always risks over- or under-estimation.
Three spots people get wrong
The formula is two divisions. What's wrong isn't the formula — it's the values you feed it.
The "customer" in numerator and denominator differ. You compute CAC on paying customers but LTV on the average of all installers. Then the ratio doesn't even hold. LTV and CAC must use the same customer definition.
Computing LTV on revenue. Even if revenue-based LTV is $240 as above, if contribution margin after cost and fees is 30%, the real money kept is $72. At CAC $100 that's 2.4:1 on revenue but under 1:1 on profit. In thin-margin businesses this gap decides life or death. Read LTV on contribution margin, not revenue.
Looking only at the blended average. Overall LTV:CAC of 3:1 often hides a mix of 5:1 channels and sub-1:1 channels. Leave it because the average looks good, and money keeps leaking into the bad channels. For budget decisions, look at the channel level.
Reading LTV:CAC
Common benchmarks:
- 3:1 — LTV is triple CAC; the ratio alone does not establish business health.
- Under 1:1 — on a contribution-margin basis, acquisition cost may not be recovered. Check the horizon and cost scope.
- Over 5:1 — a candidate for testing expansion, not proof that additional spend will retain the same efficiency.
But 3:1 is a convention born in SaaS. The right line varies by industry and margin structure — with thin margins, even 3:1 can be risky.
Also calculate the CAC payback period. Equal ratios can carry different cash requirements when recovery takes longer. Record monthly cohort contribution and unrecovered status separately.
Where you use it
- Channel-level LTV:CAC comparison → where to load more budget. The basis for budget allocation.
- ROAS maturity → how recovery builds over time.
The operations dashboard exposes revenue and install-based ratios and ROAS maturity. Its denominator can be installs or actions when mapped, and revenue recovery includes model extrapolation. Select installs for the demo below. That differs from this article’s first-time-paying-customer and contribution basis. The demo teaches the tool workflow using separate data. Public-sheet imports must be reloaded with the button; they do not synchronize automatically.
When the ratio differs by channel, the next question is allocation — marketing budget allocation covers where to move budget, and ad budget scaling limits covers how far to raise it.
Limits of this approach
LTV is a future estimate, so it can be wrong. Rather than "LTV:CAC is 4:1, so pour in more," weigh the estimate's uncertainty (data window, cohort size) and decide conservatively.