Only compare a D7 cohort after every user in that cohort has had seven full days to return. If your data ends on July 30, a cohort acquired on July 28 has not had a chance to reach D7 yet. Treating it as zero—or quietly averaging it in—makes retention look worse than it is.
Retention cohort analysis groups people who started at the same time, then measures whether they return and perform a meaningful action later. It is not a single all-user retention number. That distinction matters whenever acquisition volume, channel mix, or product releases change.
Define the cohort before reading the chart
For an app, a cohort commonly starts on install_date or first_open_date. It may then be split by network, campaign, OS, country, or an early product action. The basic calculation is:
Dn retention = users in the starting cohort who perform the defined return action on day n ÷ users in the starting cohort × 100
The return action needs a product-specific definition. An app open can be useful for a daily-use product; completing a meaningful action may be better for a marketplace or B2B product. Document the starting event, return event, timezone, and interval before comparing numbers.
Google Analytics defines cohorts through shared first-session dates and supports retention as cohortActiveUsers / cohortTotalUsers. Use its cohort specification and report examples to align the team’s GA4 definition.
Use the data maximum date, not today’s date
Write down two dates before calculating a report: the cohort start date and the latest event date available in the source data. With data through July 30, the latest eligible daily cohorts are July 29 for D1, July 23 for D7, and June 30 for D30.
Use the source-data maximum, not the current date. A delayed pipeline, late upload, or timezone boundary can make the latest calendar day incomplete. Mark immature cohorts as incomplete or N/A and exclude them from mature-cohort averages.
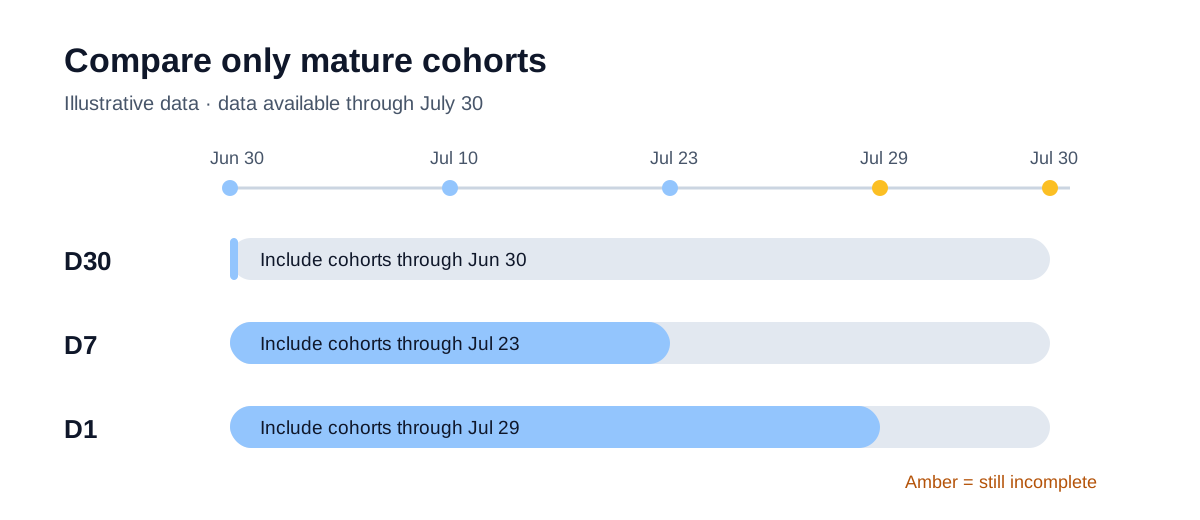
| Metric | Latest daily cohort available when data ends July 30 |
|---|---|
| D1 | July 29 |
| D7 | July 23 |
| D30 | June 30 |
Date boundaries and timezones vary by product. Amplitude, for example, supports both user-specific rolling 24-hour windows and strict calendar dates. A metric called D1 is not directly comparable when the tool, timezone, or starting event differs. Document the rule and review how time works in retention analysis.
Illustrative example: how immature cohorts distort D7
This is illustrative data, not an industry benchmark.
| Acquisition cohort | Users | Mature for D7? | D7 retention |
|---|---|---|---|
| July 10 | 1,000 | Yes | 18% |
| July 17 | 1,100 | Yes | 17% |
| July 24 | 1,300 | No | Incomplete |
| July 29 | 1,500 | No | Incomplete |
The user-weighted D7 retention for the two mature cohorts is about 17.5%. If the two immature cohorts are treated as 0%, the number appears to fall to about 7.5%. That is a reporting error, not evidence that users suddenly churned.
To keep users who are not yet fully observed and calculate when they first stopped, see user churn timing with survival curves.
Arithmetic: retained users = 1,000 × 18% + 1,100 × 17% = 367. Mature cohorts give 367 ÷ 2,100 = 17.48%; including immature users in the denominator gives 367 ÷ 4,900 = 7.49%.
Analytics products may flag recent, incomplete intervals for the same reason. See Amplitude’s Retention Analysis FAQ for how incomplete periods affect interpretation.
“D7 retention” can mean different things
| Definition | Question answered | Best use |
|---|---|---|
| Classic / Return On | Did the user return exactly on day 7? | Daily habits and exact cadence |
| Rolling / Return On or After | Did the user return on day 7 or later? | Eventual return and long-term reactivation |
| Bracket | Did the user return during a chosen window, such as days 1–7? | Weekly or irregular product cadence |
Do not compare these definitions as if they were interchangeable. A calendar-day D7 and a rolling 24-hour D7 may also differ. Label reports with the complete rule, such as D7 Classic, UTC+9, first_open → value_event.
Read the heatmap before the average
The heatmap’s rows are cohort start dates, its columns are elapsed periods, and its cells are retention. Before using a single average, ask:
- Are several comparable mature cohorts declining, or is one small cohort an outlier?
- Is D1 down, or does decline begin after D1? A D1 issue points first to acquisition promise, onboarding, or technical friction. A later decline points more often to repeat value, reminders, or content supply.
- Does the decline exist only in one channel, OS, country, or app version?
- Are new rows incomplete and visually mixed into mature data?
Show cohort size. In a ten-user cohort, one retained user changes retention by ten percentage points. Aggregate to weekly cohorts when daily volume is too small, but do not merge groups with meaningfully different definitions—such as iOS and Android—without keeping the split visible.
What to check after a retention change
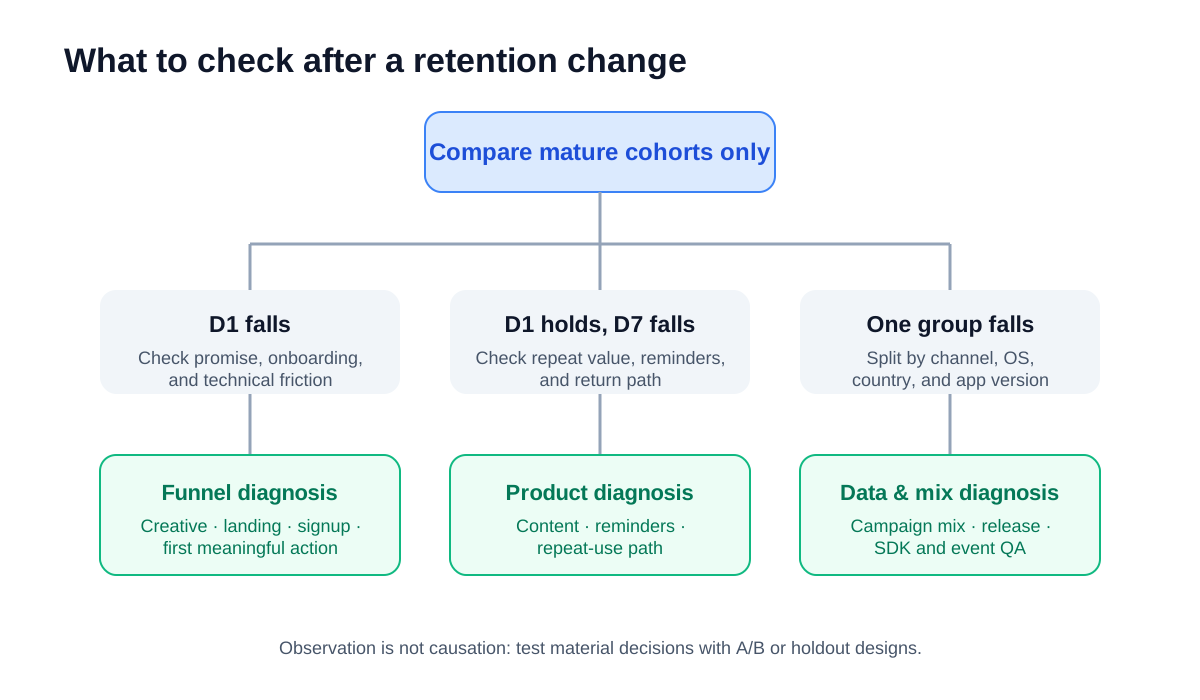
| Observation | First question | Next action |
|---|---|---|
| D1 falls | Did acquisition promise diverge from first experience? | Audit creative, landing, signup, and first-value funnel |
| D1 holds but D7 falls | Has repeat value weakened? | Review reminders, content supply, and repeat-use path |
| One channel falls | Did traffic quality or campaign setup change? | Split by campaign, creative, and placement |
| One OS falls | Did a release or SDK issue affect users? | QA version-level events, crashes, and login flow |
| Early behavior differs | Which behavior predicts later retention? | Analyze Aha Moment candidates, then test causality |
Total retention can fall even when each channel’s retention is unchanged. For example, a lower-retention paid channel may grow from 10% to 40% of new users. Check channel-level retention and each channel’s share of acquisition before calling it a product regression.
An early behavior associated with retention is not automatically its cause. High-value users may be more likely to perform it. Use Aha Moment analysis to identify candidates, then test them with an A/B test or holdout when the decision is material.
Retention cohort checklist
- Starting and return events are explicit.
- Timezone, interval, and retention type are documented.
- D1, D7, and D30 include only cohorts mature for that interval.
- Incomplete cohorts are not recorded as zero.
- Cohort size and aggregation level are visible.
- Channel, OS, country, and mix changes are checked.
- Observed correlation is not presented as causation.
Conclusion: compare equal observation windows first
Correct D1, D7, and D30 interpretation starts with mature cohorts—not more charts. Confirm the maximum available event date, compare only users with equal observation time, and keep the retention definition fixed. Then the heatmap can tell you whether to investigate acquisition, onboarding, repeat value, or data quality.
Next, use the Cohort-Based Retention Guide to connect retention to LTV, then identify candidate early behaviors in the Aha Moment tool before changing optimization or onboarding.
Try this today
Open your retention table and check whether the most recent rows are immature. A cohort that installed yesterday has no D30 yet; if that renders as 0 rather than blank, your recent cohorts look like a collapse that never happened. This is the single most common false alarm in retention reporting.
Check how your averages are computed. If several days' retention rates are averaged without weighting, a 100-user cohort counts the same as a 10,000-user one. Weight by cohort size and the trend often changes direction.
Limits of this approach
Retention benchmarks from outside your product are mostly unusable. The normal range varies so much by category, monetisation model and acquisition mix that an external average tells you little, and the sourcing is frequently unclear.
Start with your own comparable past cohorts; external benchmarks can add context only when definitions, populations, and observation windows align. Stack the last 8–12 weeks and ask whether this cohort sits inside or outside that band. That comparison answers a real question; comparing against someone else's number mostly generates false confidence in both directions.