A strong LTV:CAC ratio does not tell you when acquisition cash comes back. The CAC payback period measures when a new-customer cohort has generated enough cumulative contribution to recover its acquisition cost. This article uses a contribution basis explicitly, rather than treating revenue recovery as profit recovery.
Download the monthly calculation CSV to check the table. It is a payback worksheet, not a campaign-format input for the analysis tool.
Align the customers and acquisition costs
Assume 100 first-time paying customers acquired in one month cost KRW 10,000,000. CAC is KRW 100,000 per new customer. Include allocated acquisition-related sales or production costs if they belong to your definition, and disclose the scope. Neither installs nor order counts substitute for distinct new paying customers.
The CSV repeats new_customers and acquisition_cost_krw as fixed cohort metadata; do not sum those columns across months. Track the subsequent contribution of those same 100 customers. Do not remove churned customers from the original denominator: averaging only survivors can overstate recovery. Start with the LTV:CAC calculation guide if the definitions differ between reports.
State what you subtract from revenue
In this example, contribution is gross revenue minus refunds and cancellations, product cost, payment fees and variable service costs. Acquisition cost sits separately as the recovery target; do not subtract it a second time from monthly contribution. Different cost definitions produce different results.
| Month | Gross revenue, KRW | Refunds | Variable costs | Contribution | Cumulative contribution |
|---|---|---|---|---|---|
| 1 | 4,500,000 | 500,000 | 2,000,000 | 2,000,000 | 2,000,000 |
| 2 | 5,000,000 | 500,000 | 2,000,000 | 2,500,000 | 4,500,000 |
| 3 | 5,000,000 | 500,000 | 2,000,000 | 2,500,000 | 7,000,000 |
| 4 | 4,500,000 | 500,000 | 2,000,000 | 2,000,000 | 9,000,000 |
| 5 | 3,500,000 | 500,000 | 1,500,000 | 1,500,000 | 10,500,000 |
A late refund can revise cumulative contribution and the recovery conclusion. Decide which figures remain provisional and when to close the report.
Find the first observed interval above the target
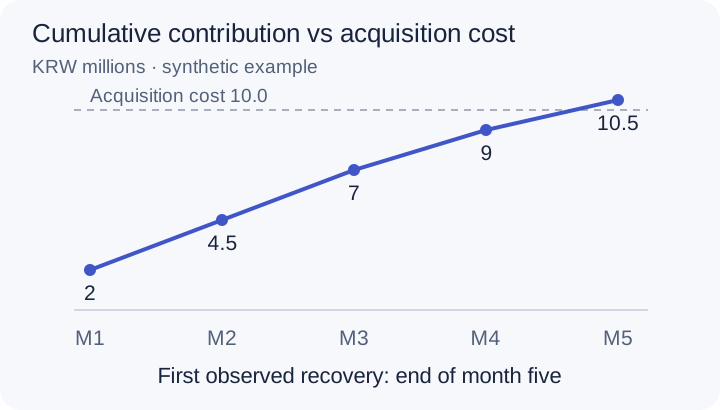
Cumulative contribution is KRW 9,000,000 at month four and KRW 10,500,000 at month five. The first observed month-end recovery is therefore month five. These monthly observations cannot identify the exact day of recovery.
Assuming contribution accrues uniformly in month five, interpolation gives 4 + (10,000,000 − 9,000,000) ÷ 1,500,000 ≈ 4.67 months. That is an assumption-based interpolation, not an observed recovery date.
Label unrecovered cohorts honestly
If only three months are observed, report “unrecovered through month three.” Do not enter zero months or infer permanent unprofitability without assumptions about the future. A forecast needs a disclosed observation window, revenue and churn assumptions, and uncertainty.
The shortcut CAC divided by monthly contribution per customer assumes stable monthly contribution. Use the cumulative cohort table when churn or payment patterns vary. Stripe’s explanation also distinguishes the payback period from the LTV:CAC ratio.
Keep the tool’s revenue recovery separate
The demo below uses a separate synthetic dataset to explore revenue and install-based LTV in the operations dashboard. It does not reproduce the monthly contribution worksheet. Inspect the revenue windows and install counts before opening the full tool’s LTV section.
The tool supports install or action denominators when mapped. Select installs for this demo. Its payback estimates when modeled cumulative revenue per selected unit reaches acquisition cost. Its numerator, denominator and estimation method differ from contribution recovery for new paying customers. Do not put contribution into a revenue column and label the results as the same metric. The tool result alone establishes neither business break-even nor a safe scaling budget.
Include recovery capacity in the budget decision
Fast recovery does not guarantee the same efficiency at the next spend level. Combine marginal budget allocation with available cash, your acceptable recovery horizon and cohort maturity. Five months in this example is not an industry recommendation.
At the next review, check the same cohort’s cumulative contribution and any refund or cost-allocation revisions. The weekly report worksheet can hold that decision and its review conditions.