A weekly marketing report should leave the reader with a decision to make or a question to resolve. Copying spend and installs into a slide is only the beginning. Record the evidence, the hypothesis, the owner and the next review date.
This worked example uses synthetic install-campaign data. Download the campaign CSV, blank report worksheet and completed example. Only the campaign CSV is an analysis input; the other files are writing worksheets.
Fix four comparison conditions first
Compare August 31–September 6, 2026 with September 7–13: two Monday-to-Sunday weeks. The time zone is Korea, the currency is KRW, and the outcome is installs under one attribution definition. Both weeks are assumed mature in this example. For a real export, record the extraction time and check platform-specific conversion lag.
Installs cannot stand in for new paying customers. Resolve mixed purchase, signup and install definitions using the data preparation guide. Compare ROAS only when the revenue observation windows also match.
Spend rose 20% while installs stayed at 700
| Campaign | Prior spend / installs | Current spend / installs | Cost per install |
|---|---|---|---|
| A | KRW 350,000 / 350 | KRW 420,000 / 280 | 1,000 → 1,500 |
| B | KRW 350,000 / 350 | KRW 420,000 / 420 | 1,000 → 1,000 |
| Total | KRW 700,000 / 700 | KRW 840,000 / 700 | 1,000 → 1,200 |
Spend increased by KRW 140,000 without adding installs overall. A lost installs after spending more; B's spend and installs rose together. Calculate total CPI from total spend divided by total installs, not the unweighted average of campaign CPIs.
Inspect the campaign changes in the CSV
Open the demo below and check the spend and install mappings. In the full campaign-variance tool, select the two periods above and compare the totals with the table. The practice file contains 42 rows across three weeks. Compare the first two weeks (28 rows) first.
The decomposition describes arithmetic components of observed change. It cannot establish whether creative, auctions or tracking caused A's decline. Follow the performance diagnosis guide to inspect change history and narrower metrics.
Separate observations, hypotheses and decisions
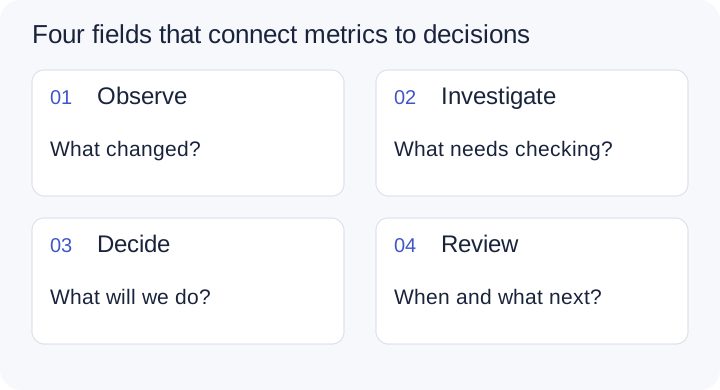
| Field | Completed example |
|---|---|
| Observation | Spend +20%; installs remain 700. A's CPI +50% |
| Hypothesis to check | Did A's placement mix, creative or tracking change in the same week? |
| Decision | Hold further scaling of A. Do not scale B solely on its current average efficiency |
| Owner and review | Campaign owner; review on September 21 after checking maturity |
September 21 is this example's review commitment, not a universal data-finalization date. Specify both when to review and what to inspect. B's stable average efficiency does not guarantee the same return on additional spend. Check marginal efficiency and allocation separately.
Start next week with the previous decision
Ask whether the reason for holding a decision has been resolved. Record campaigns left unchanged too: that helps distinguish actions taken from external changes later.
Use weekly review to revisit the periods, KPI and decision. Running analysis and viewing results are free. Projects and new review or decision saves require active Pro; saving decision records also requires sign-in. The 7-day trial includes project and review storage, while analysis-report downloads require a purchased pass. The public examples and blank worksheet in this article are separate from product-generated report downloads.
Week 3: keep the decision or change it?
This is a synthetic learning scenario, not a customer result. Assume each campaign keeps weekly spend at KRW 420,000 for September 14–20. Both periods use equally mature install counts and the same attribution definition. These assumptions do not establish a causal effect.
Upload the three-week campaign CSV to the same campaign-variance tool. Set the previous period to September 7–13 and the current period to September 14–20. The file has two campaigns × 21 days, or 42 rows. Its first two weeks match the earlier example.
| Campaign | Week 2 spend / installs | Week 3 spend / installs | Cost per install |
|---|---|---|---|
| A | KRW 420,000 / 280 | KRW 420,000 / 350 | 1,500 → 1,200 (−20%) |
| B | KRW 420,000 / 420 | KRW 420,000 / 420 | 1,000 → 1,000 |
| Total | KRW 840,000 / 700 | KRW 840,000 / 770 | 1,200 → about 1,091 (−9.1%) |
A gained 70 installs, but its CPI remains 20% above the first week's KRW 1,000. Record the observation, operating decision and causal conclusion separately rather than assuming recovery justifies scaling.
| Review outcome | Record in this example | Next evidence |
|---|---|---|
| Keep | Hold further scaling of A; maintain B's current spend | Spend and installs for the next complete, comparable week |
| Revise | Change A's review question from ‘why did it worsen?’ to ‘does the recovery persist?’ | Placement, creative and tracking history; daily trends |
| Withhold judgment | A's recovery cause and returns on extra budget remain unidentified | Further evidence or a separately designed experiment |
These are not three simultaneous statuses for one decision. Keep the budget action, revise the follow-up plan, and withhold the causal claim. Crossing a business target alone does not establish whether advertising had an effect.
Turn the follow-up into a completed report
The completed week-three review is a free writing example containing the previous decision, new observations, reasoning, next action and limitations. It is not an analysis input or a project backup.
- Select Open analysis with demo in the practice below. It loads the three-week CSV. Compare weeks 1 and 2 first, then switch to weeks 2 and 3.
- To practice saving, create a separate example project and upload the three-week CSV yourself. Preview-only demo mode does not save real project records. Review the action, reasoning and review date, then save to your example project. This example keeps A's scaling on hold and schedules the next review for September 28.
- After checking the next results, open the saved decision in Projects and record the observation and next action. Check the tool's supported comparison scope; record evidence manually where automatic comparison is unavailable.
- Open Preview my report · Free to check included decisions, periods and limitations. An active purchased pass unlocks the supported Word and Excel downloads.
A completed conclusion reads: “A's CPI fell from KRW 1,500 to 1,200 but remains above the baseline week's 1,000. Keep further scaling on hold and review the next complete week alongside the change log. This comparison alone cannot identify the recovery cause or the effect of additional spend.”
Reduce repeated work at the input stage
If combining exports takes most of the week, continue with BigQuery, Google Sheets and analysis-ready CSVs. A cleaner collection process still needs definition and maturity checks. A report becomes reusable when the next week's data can actually test the decision you recorded.