Marketing report automation starts with reducing repeated export preparation. BigQuery can prepare aggregates and Google Sheets can support review, but first define which rows are safe to combine and where scheduled refresh ends.
If your CSV is already clean, you do not need to introduce BigQuery. Choose the path that fits the work. The demo in this article checks the analysis-ready CSV at the end of the process.
Choose one of three paths
| Path | Suitable situation | Work that remains |
|---|---|---|
| Platform CSV → browser analysis | Occasional analysis of a few accounts | Export, inspect columns and upload |
| Private internal Sheets → CSV → analysis | A team prepares and reviews a table | Verify refresh, download CSV and upload |
| BigQuery → Connected Sheets → CSV → analysis | Repeated collection into BigQuery already exists | Queries, refresh schedules, permissions and the final upload |
BigQuery does not automatically collect advertising-account data. Connectors or transfer jobs are a separate setup with their own platform support and costs. Growth Opt Playbook does not connect directly to ad-account APIs.
Align dates, campaigns and outcome definitions
The example grain is date × channel × campaign. Dates use Korea time, spend is KRW and the outcome is installs. Appending total rows to their underlying detail rows counts the same amounts twice.
| Output column | Meaning in this example | Check |
|---|---|---|
| date | Reporting date | Are UTC and Korea dates mixed? |
| channel | Platform or channel | Have typos and whitespace been resolved? |
| campaign_id | Campaign identifier | Is the account ID included when needed to distinguish accounts? |
| campaign_name | Campaign name | Do IDs distinguish different campaigns with identical names? |
| cost | Ad spend in KRW | If converted, are the rate and effective date recorded? |
| installs | Installs under one definition | Are signups, purchases or duplicate installs mixed in? |
| impressions, clicks | Impression and click counts | Are platform definitions comparable? |
Adding platform-attributed installs does not create a deduplicated new-user count. Check attribution discrepancies first. Keep different outcomes separate instead of forcing them into one column.
Prepare a read-only BigQuery aggregate
This query assumes an internal table whose units and duplicate handling have already been resolved. Replace the project, dataset, table and dates for your environment. It does not output customer identifiers.
SELECT
  report_date AS date,
  channel,
  campaign_id,
  campaign_name,
  SUM(cost_krw) AS cost,
  SUM(installs) AS installs,
  SUM(impressions) AS impressions,
  SUM(clicks) AS clicks
FROM `your_project.reporting.campaign_daily`
WHERE report_date BETWEEN DATE '2026-08-31' AND DATE '2026-09-13'
GROUP BY report_date, channel, campaign_id, campaign_name
ORDER BY date, channel, campaign_id;
Here report_date is a Korea-aligned DATE column and the remaining measures are numeric. If the source contains event timestamps, design the date conversion and deduplication first. Check nulls, row counts and source totals separately: converting missing values to zero can disguise missing data, while SUM ignores nulls.
BigQuery scheduled queries can repeat the aggregation. Scheduling the fixed-date query above does not advance it to the next reporting period. Production use needs explicit reporting-period parameters and a reprocessing policy.
Separate Sheets refresh from importing into the site
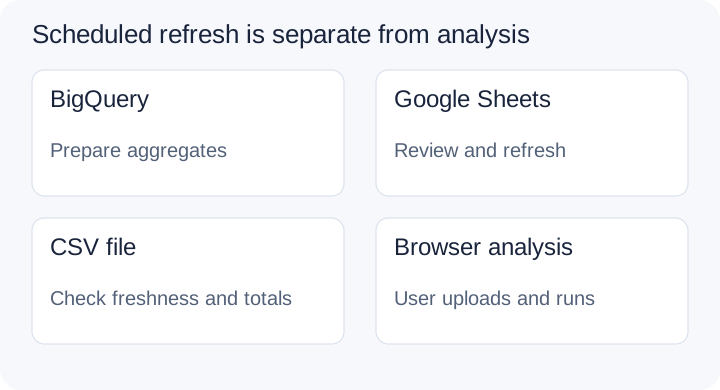
Follow Google’s Connected Sheets guidance to connect BigQuery data, inspect results and configure scheduled refresh. Confirm account and Workspace availability, BigQuery permissions and the billing-project requirements. Queries, storage and collection can incur costs; do not assume the pipeline is free.
Use this connection sequence; menu labels can vary with the account language.
- In Sheets, open Data → Data connectors → Connect to BigQuery. Select an authorized project and the prepared aggregate table or view.
- Do not treat the connection preview as a complete export. Create an Extract of the required columns and compare it with source aggregates to catch truncation from row limits.
- Open Refresh options and configure Schedule refresh after the upstream aggregate is ready. Refresh once manually to verify success.
- Export the reviewed aggregate table as CSV, check mappings in the site and analyze. Next week, confirm the dates actually advanced.
Google’s hands-on guide covers extracts and scheduled refresh. Delegated access, which lets others use a connection owner’s access, cannot be used to set up scheduled refreshes. A shared sheet alone does not establish refresh permissions.
After refresh, inspect the last successful refresh, maximum data date, row count and totals. Refreshing Sheets before the upstream aggregate completes can read stale data. Prepare only the necessary aggregate columns in a regular table and export CSV, then check the mappings in the practice below. The demo uses the same 28 rows as the weekly report example.
Use CSV for private business data
The site's Google Sheets connection requires a public URL readable without authentication. It does not open private sheets through OAuth or control Connected Sheets schedules. Updating a sheet does not automatically update analysis results already open in the site.
Keep internal sheets private. Export only the necessary aggregates from an authorized environment and upload the CSV. For a separate sample sheet safe to share publicly, enable link-based reading, copy the target tab's URL including its gid, and paste it into the site's Google Sheets connection field. Use ‘Load latest data’ to fetch it again and rerun analysis. If the control is unavailable or permissions or network access fail, use CSV instead.
Uploaded CSV parsing and calculation run in the browser without sending source rows to our server. This does not make a sheet you have published on Google private.
Check that the process still works next week
Record dates, periods, currency, outcome definition and extraction time. If the current total differs from the platform export for an unknown reason, inspect duplicates, filters and reporting lag before finalizing the report. Continue with the CSV preparation guide for mappings and the weekly marketing report for decisions.
Analysis is free. Projects and review storage require active Pro; saving decision records also requires sign-in. This workflow reduces repeated preparation while preserving comparison checks. It does not promise automated collection or unattended analysis by this site.