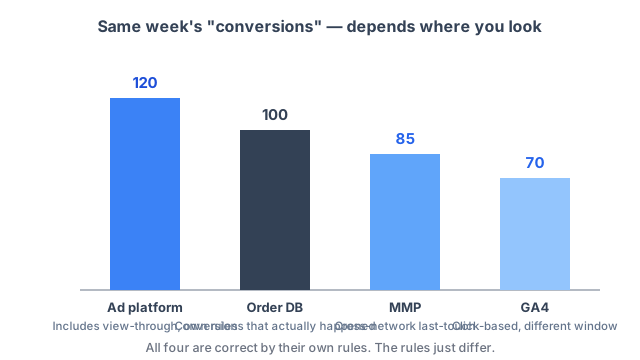
Same week, same conversions — Meta's dashboard says 120, GA4 says 70, your MMP says 85. Open the order DB and it's 100. What goes in Monday's report? The short answer: "which one is right" is the wrong question. Different rules can explain the gap, but they do not establish that all four numbers are correct. Check duplicates, missing events, and integration errors. Here are the four reasons they diverge, and which number to anchor on for which purpose.
First choose: do systems disagree, or does GA4 itself look wrong?
- Meta, GA4, MMP, and the order database disagree: stay here. This is about aligning attribution rules and choosing a reporting source.
- GA4 sessions differ from UA, yesterday's conversions keep changing, or unassigned grows: start with GA4 data traps. That is a GA4 definition, processing-lag, or threshold question.
Both symptoms sound like “the numbers do not match,” but they lead to different fixes. Set the reporting source first, then inspect the product analytics setup.
When conversion counts differ across systems
Why this actually becomes a problem
Numbers differing isn't the incident. The incident comes after: you report channel performance off ad-platform numbers, someone adds them up, and the total exceeds the order DB. From that moment, the entire marketing report is under suspicion. Once you hear "are your numbers inflated?" once, it takes months to earn that trust back. So you need to be able to explain the divergence — and set the ground rules in advance.
Reason 1. Attribution windows differ
The window during which a conversion gets credited to an ad varies by system. Check the actual click, view, and engagement windows for the campaign and current settings; do not assume a universal default. Google and various MMPs each have their own defaults. A longer window catches more conversions, so numbers with different windows are not directly comparable, even if they happen to match. Someone who clicks and buys 9 days later might be missing from Meta's dashboard but present elsewhere.
Reason 2. Whether "views" count at all differs
Ad platform dashboards count view-through conversions — someone who saw the ad but never clicked, and converted anyway — as their own credit. GA4 can also include YouTube engaged-view key events depending on configuration and report; it is not simply click-only. See Google’s documentation. The gap widens for impression-heavy channels like display or video. This is a big part of why ad-platform numbers tend to run higher.
Reason 3. The credit date differs
Meta attributes a conversion to the date of the ad touchpoint. GA4 logs it on the date the conversion actually happened. Someone who clicked an ad last week and paid yesterday shows up as last week's result in Meta's report and yesterday's result in GA4. Most of the subtle mismatches around weekly/monthly close come from exactly this.
Reason 4. Everyone claims to be the last touch
Each ad platform has no visibility into what other platforms did. So each one credits itself whenever it had a touchpoint. If someone sees a Meta ad, then clicks a Google Search ad and converts, both platforms claim that same conversion. This is the structural reason summing ad-platform numbers overshoots reality.
On top of that, iOS adds another layer. Since tracking restrictions kicked in, ad-platform numbers blend real measured conversions with modeled/estimated ones. Modeling isn't inherently bad — but you need to know that "measured" and "estimated" are merged into one cell before you read it.
So: match the number to the question
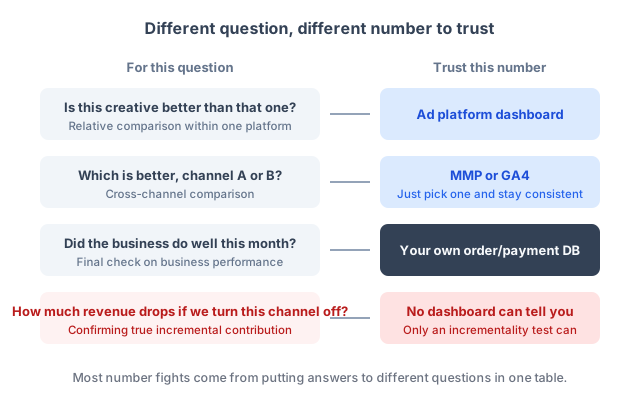
Comparing campaigns or creatives within the same platform? Use that platform's dashboard. Consistent rules help, but audience, delivery allocation, and maturity differences can still bias relative comparisons. Validate a creative winner with a designed experiment.
Comparing across channels? Pick one — MMP or GA4 — and stick with it. Either works, as long as you're consistent. The worst move is cherry-picking whichever number flatters each channel. The moment you do, meetings stop being analysis and become negotiation.
Judging whether the business did well? Your own order/payment DB is final. However attribution splits things up, the actual total volume of conversions that happened lives here. Validate every report's total against this number.
And one more thing: "how much revenue drops if we turn this channel off" — none of the numbers above can answer that. They're all observational data, mixed in with conversions that would have happened anyway without the ad. That question can only be answered with an incrementality test. If you want to decompose the contribution of every channel at once, that's MMM territory.
By the way, if GA4's own numbers feel off, that is a separate issue. After setting the reporting source, check GA4-specific traps such as session definitions and processing lag in GA4 data traps.
Try this today
Build a one-page "source of truth" document. Four columns per metric: which metric / which source / which window / when it's considered final. Example: "channel-level conversions: MMP, 7-day click, provisional review at D+3, with finalization based on observed reporting delay." Having this one page eliminates half the meetings that start with "your number doesn't match mine."
Once your source of truth is settled, the next question shows up: "so where should we actually put more budget?" That calculation doesn't come out of dashboard numbers alone, and running it in a spreadsheet every time gets old fast. Drop your ad platform report or MMP export CSV into our marketing response analysis — MMM-based estimates run in the browser when the input provides the required weekly channel panel and conditions, and nothing goes to a server.