You pulled last week's conversions Monday, check again Wednesday, and the number went up. Sessions are lower than what you remember from UA. The channel report has a pile of "unassigned." If you've ever wondered whether you can trust GA4's numbers, you're not alone. Counting rules can explain differences, but actual tracking errors still need investigation. Use the seven checks below to distinguish definitions from collection errors.
First choose: a GA4 issue, or a cross-system comparison issue?
- Session definitions, processing lag, thresholds, or unassigned traffic make GA4's own screens look inconsistent: stay with this article.
- Meta, GA4, MMP, and the order database report different conversions: start with aligning ad-platform, MMP, and GA4 numbers. That is about choosing the right source for the reporting question.
Choose the scope before changing settings. It prevents you from treating a legitimate cross-system attribution difference as a broken GA4 configuration.
What to check first when GA4 numbers look off
Start with the symptom
| Symptom | First checks |
|---|---|
| Yesterday’s value changes in the same report | Check 3: processing and attribution revisions |
| User or conversion totals differ across reports | Checks 1–2: metrics and dates; 4–6: quality indicators |
| Traffic shifts toward direct or unassigned | Check 7: attribution, tagging and collection errors |
Both definition differences and real tracking errors are possible. Record the report names, filters and extraction times before changing settings.
Trap 1. Metrics and scopes may differ
Event count, key-event count, users and sessions are different measures. A purchase can produce several events and one person can return in multiple sessions. Check the exact metric name and key-event counting configuration.
Traffic-source dimensions also have first-user, session and event scopes. Follow Google’s scope definitions to align acquisition, the current visit or credit for a key event. Do not directly compare totals from different filters, comparisons or reporting identities.
Trap 2. Dates depend on time zone and attribution timing
September 14 at 00:30 in Korea is September 13 at 15:30 UTC. The same event can land on different dates. Check the property’s reporting time zone and how the export constructed its date column.
Even with aligned time zones, an ad-interaction date can differ from a conversion date. Use equal-length reporting periods and record inclusive boundaries and attribution timing.
Trap 3. Yesterday's number isn't final yet
Google’s data-freshness guidance describes 24–48-hour processing and key-event attribution credit that may change for up to 12 days after recording. Processing and reattribution are different processes; D+3 is not a universal finalization point.
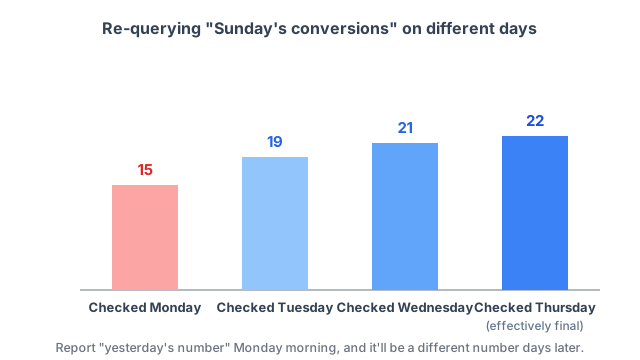
If you drop yesterday's raw number into a Monday morning report, you'll get "why is this different from what you told me" a few days later. That's a trust problem, not a data problem. The fix is deciding on a finalization point in advance: treat daily numbers as trend indicators only, and choose a reporting cutoff after checking each metric’s latency and reattribution. Tell the team upfront — "D+3 is provisional; review delayed events and reattribution before closing" — and the follow-up questions disappear.
Trap 4. Thresholds can limit displayed data
Privacy thresholds can restrict reporting for particular dimensions or small populations. A missing row is not evidence that the group contains zero users.
Check the data-quality indicator and Google’s threshold guidance. Review the date range and dimensions. Do not assume changing reporting identity removes every threshold or changes remarketing settings.
Trap 5. Sampling differs from reading all events
Some explorations can use a sample depending on query size and other conditions. Inspect the quality indicator for whether sampling applies and how much data was used. A numerical difference alone does not identify sampling.
Sampling estimates results from a subset; thresholds limit disclosure for privacy. Use Google’s sampling explanation to distinguish them before changing periods, dimensions or query methods.
Trap 6. The ‘(other)’ row can contain grouped values
High-cardinality dimensions can cause less common values to be combined into an ‘(other)’ row because of reporting row limits. Review dimension design if identifiers in URLs create excessive unique values.
Check Google’s explanation of the (other) row. Removing that row and summing only visible detail can lose part of the reported total. This is distinct from sampling and privacy thresholds.
Trap 7. Attribution and tagging need separate checks
Models, lookback windows and eligible interactions can assign different credit to the same key event. Non-click interactions such as engaged-view key events depend on their settings and eligibility conditions.
Missing UTMs or parameters lost through redirects are separate collection problems. If direct or unassigned rises, inspect actual landing URLs and source/medium values; do not assume the two channel labels share one cause. Continue cross-system comparisons in attribution data mismatch.
Record the comparison conditions
Align metrics, scopes, time zones, dates, filters and quality indicators, then investigate residual differences in collection and aggregation. Cross-tool comparison is possible when definitions are aligned; disclose the parts that cannot be reconciled.
Record extraction time and provisional or closed status in the weekly report worksheet. To reduce repeated preparation, use the BigQuery and Sheets workflow.
Try this today
Choose two conflicting reports and write down their metric, traffic scope, time zone, period, filters, quality indicators and extraction times. Align one condition at a time to locate the difference.
Check thresholds, sampling and attribution configuration in GA4’s quality indicators and settings. Once campaign definitions align, start an analysis to inspect performance changes.