When you operate marketing campaigns, ad performance sometimes worsens without an obvious action on your side. The first instinct is usually to blame the creative.
But a higher CPA does not automatically mean the creative is worse. Conversion tracking may have broken, budget may have shifted toward a more expensive channel, or the landing page may be the problem. Diagnose in this order: validate the number → isolate the scope → separate mix from efficiency → trace the funnel.
First choose: a sudden anomaly, or a sustained performance drop?
- A metric jumped today or over only a few recent days: start with campaign anomaly detection. First confirm that the movement broke outside its normal range.
- CPA, CTR, or conversion rate keeps worsening across multiple periods: follow this four-step diagnosis. It is for narrowing a persistent problem before changing anything.
Treating one day of noise like a long-term problem can introduce changes that disturb learning and the comparison baseline. Treating a repeated decline like noise can let the cause grow. Separate the time pattern first.
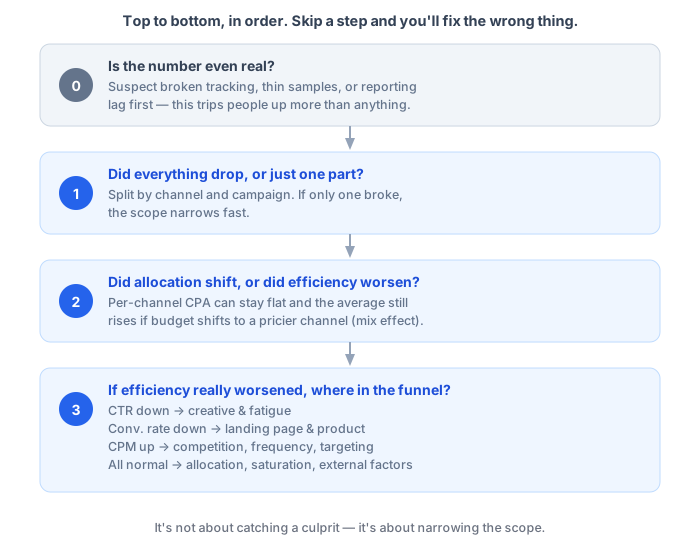
The four-step diagnosis sequence
- Validate the number. Rule out tracking errors, reporting delay, and thin samples.
- Isolate the scope. Separate an account-wide issue from a channel or campaign issue.
- Split mix and efficiency. Check whether the expensive channel gained share or performance itself worsened.
- Trace the funnel. Use CPM, CTR, and conversion rate to decide the next action.
Skipping this order can lead to replacing healthy creative, stopping a campaign that is still gathering evidence, or treating a landing-page problem as an ad problem.
Four reasons ad CPA suddenly rises
CPA is not a cause in itself — it is the result of the metrics in front of it. When CPA rises, one of these four moved first.
- CPM rose — the auction got more expensive for the same impressions.
- CTR fell — the same impressions produced fewer clicks, so each click cost more.
- Conversion rate (CVR) fell — clicks held, but fewer of them converted.
- Budget mix shifted — per-channel efficiency held, but an expensive campaign took share.
These changes can coexist, and different operational factors can produce the same metric movement. Falling CTR does not mandate new creative, and a mix shift does not rule out creative influence. The steps below narrow hypotheses.
Step 0. Is the CPA rise a measurement problem?
Validate measurement first. A change in how conversions are counted can look exactly like a performance drop. If conversions suddenly approach zero, check events, pixels, and SDKs before changing ads—especially after an app or web release. Compare the same conversion across the ad platform, GA4, MMP, and your payment database. Google Ads also starts its conversion-tracking troubleshooting with a test conversion and tag-status checks.
Do not judge yesterday's data too quickly. Google Ads documents both reporting freshness and conversion lag. Until recent conversions mature, CPA can look too high and ROAS too low; small conversion counts make the daily result even more volatile. Sometimes the honest answer is simply that there is not enough data yet.
Step 1. Is every channel down, or only one?
Break the result down by channel, campaign, OS, country, and creative. The official Google Ads performance-fluctuation checklist likewise separates tracking, settings, bidding, budget, targeting, and auction conditions.
| Observation | Check first |
|---|---|
| CPA rises in one channel | Bidding, targeting, creative, saturation in that channel |
| CTR drops across all channels | Seasonality, competition, brand context |
| Conversion rate drops across all channels | Landing page, checkout, price, inventory, app outage |
| Conversions fall but clicks and sessions hold | Event tracking and attribution setup |
| One OS drops | App release, ATT/SKAN, OS-specific landing flow |
This step does not prove a cause. It narrows the surface area worth changing.
Step 2. Did budget mix push CPA up?
Overall CPA can rise even when every channel's CPA is unchanged. If a more expensive channel takes a larger share of conversions, the blended CPA rises. That is a mix effect.
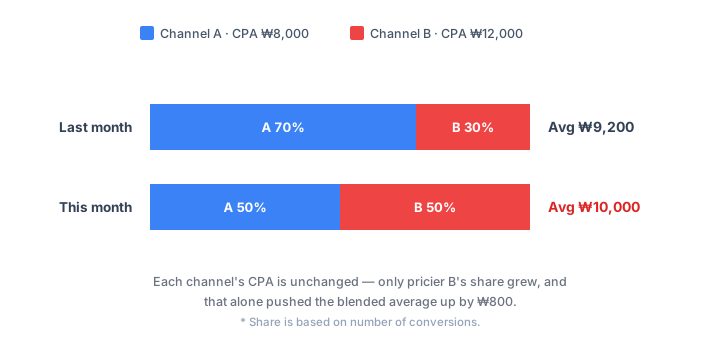
If channel CPA itself rises, that is an efficiency effect. Creative fatigue, audience exhaustion, competition, or a weaker landing experience become more plausible.
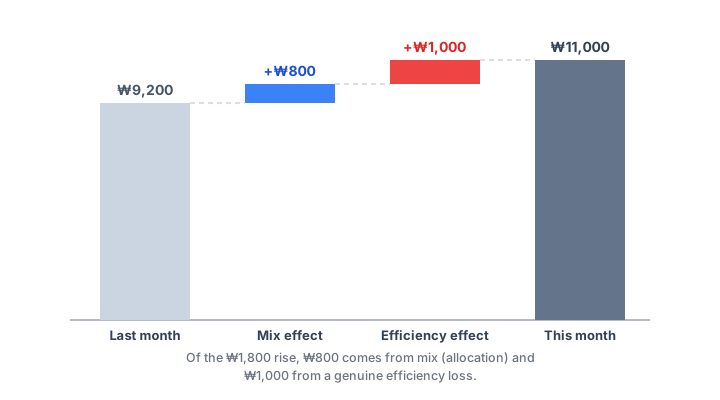
| Result | First action |
|---|---|
| Large mix effect | Review budget shifts, automated bidding, and marginal efficiency |
| Large efficiency effect | Check creative, targeting, bid settings, and conversion flow |
| Both are large | Prioritize mix and within-channel actions separately |
This decomposition describes what moved together; it does not prove why it moved. Confirm a cause by changing one condition at a time.
Step 3. Which moved — CPM, CTR, or CVR?
Trace CPM, then CTR, then conversion rate.
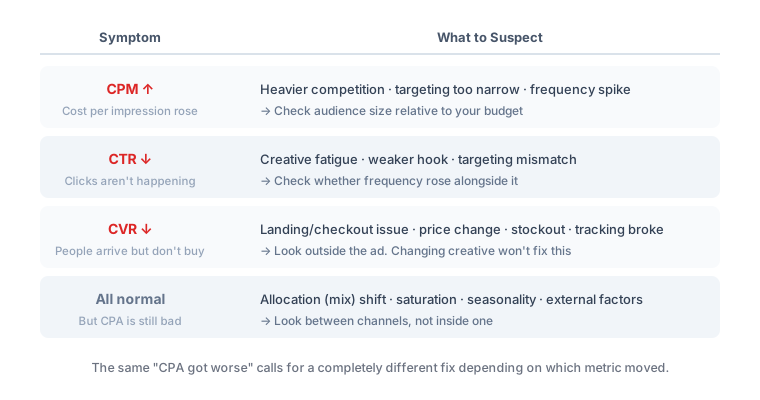
Higher CPM: inspect the auction environment
Higher CPM means the cost of buying 1,000 impressions increased. Check competition, seasonality, audience constraints, placement mix, and bidding changes together. Replacing creative alone may not fix it; also inspect audience breadth and campaign overlap.
Lower CTR: rule out three non-creative causes first
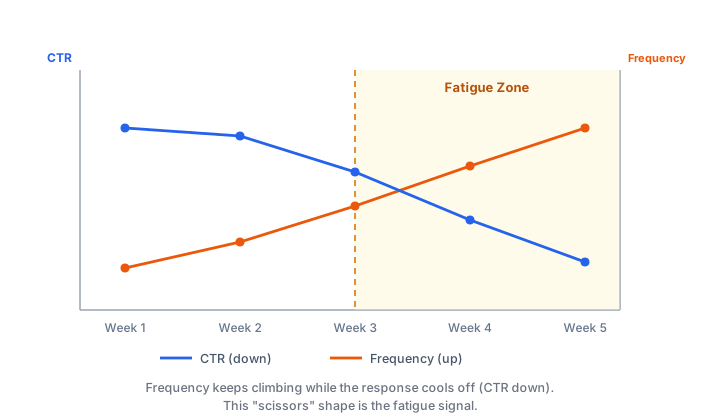
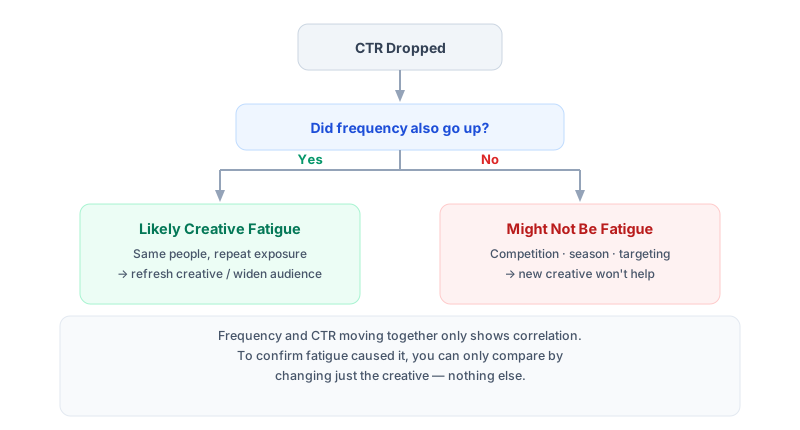
CTR can fall without any creative change when placement mix shifts, automated targeting expands, or frequency rises. If placement-level CTR holds while blended CTR falls, creative is less likely to be the primary cause. If placement-level CTR falls broadly and frequency rises too, creative fatigue is more likely.
Do not diagnose creative fatigue from CTR alone
The classic fatigue signature is rising frequency plus falling CTR. It is consistent with repeated exposure and weaker response, but the combination does not prove the cause by itself.
There is no universal rule such as “refresh at frequency three.” The useful benchmark is your own history: at what frequency and after how many days did past creatives begin to decline?
If a replacement looks necessary, do not immediately flood the account with new assets. First set the hypothesis, decision budget, and winner rule as described in the creative-testing guide, so the next drop can be compared against a clear change.
If conversion rate falls, look outside the ad first
When clicks hold but conversion rate drops, changing creative is unlikely to solve the problem. Check landing-page speed and errors, onboarding or checkout drop-off, price or inventory changes, login and payment flows, and whether the ad promise matches the first landing-page screen.
CTR is a diagnostic metric, not the final outcome. High CTR with poor conversion rate may mean you attracted attention, not qualified buyers.
Change one thing at a time
Do not change creative, targeting, budget, and bidding together. If performance recovers, you will not know what worked. Start with one hypothesis and the smallest reversible action. When data is thin or recent data is incomplete, waiting can be safer than disturbing the comparison baseline with another change.
A ten-minute weekly prevention checklist
- Did channel CPA or conversion volume move outside its usual range?
- Did budget or conversion share shift meaningfully by channel?
- Which moved first: CPM, CTR, or conversion rate?
- Do older creatives show rising frequency and falling CTR together?
- Were there landing, app-release, pricing, promotion, or inventory changes?
- Is the next change limited to one variable?
If revenue worsened too, ROAS drop causes and fixes is the next read; if Step 3 narrowed the cause to conversion rate, conversion rate optimization goes deeper stage by stage.
To repeat this check next week, open Weekly Review, analyze a CSV with date, campaign, spend, and conversions, and record a goal and guardrail. Start with two comparison periods; later, a current-period CSV can use a saved aggregate when dates and currency match. Copy or print the report, while remembering that a weekly comparison does not establish the causal effect of a decision.
Closing
Ad performance decline is not a single-creative problem. It connects measurement, budget allocation, auctions, creative, and the landing experience. Keep this sequence as a team checklist: validate data → isolate scope → split mix and efficiency → diagnose the funnel.
For recurring checks, use the operations dashboard and campaign performance variance analysis to inspect channel movement and mix-versus-efficiency contribution. Your data is processed in the browser only.