There is no universal answer such as “always test three creatives.” The number of creatives you can test at once depends on two inputs: the budget available for one test batch and the amount each creative needs before you can make a useful decision.
Adding more creatives without increasing the budget spreads delivery thin. Some ads receive too little exposure to tell you whether they failed or never had a fair chance. The goal is not to launch the most assets. It is to give each hypothesis enough opportunity to produce an answer.
The short answer
- How many creatives? Test
⌊test-batch budget ÷ decision budget per creative⌋assets. Round down so every asset keeps its decision budget. - Which metric decides? For sales or acquisition, prioritize CPA, ROAS, or conversion rate. Treat CTR as a diagnostic metric.
- When do you decide? After the minimum observation period, decide when either adequate conversion evidence is available or the decision-spend cap is reached.
- What if delivery is uneven? Classify the result as a hold or rerun it with an official platform experiment instead of forcing a loser decision.
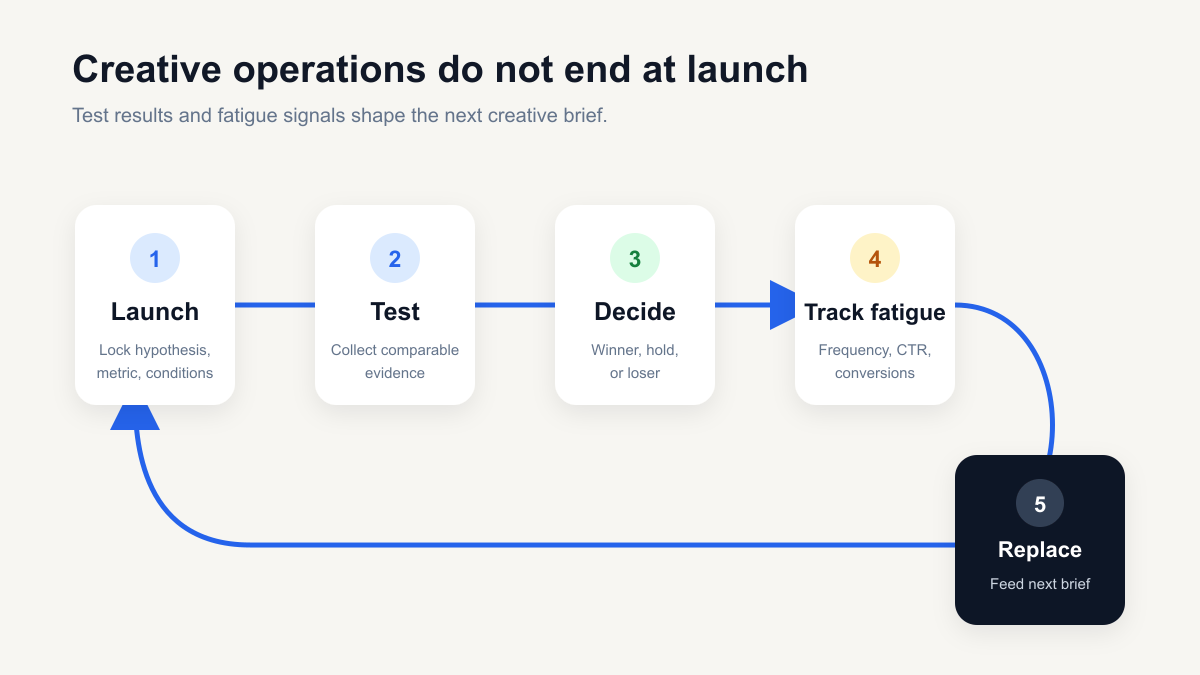
Creative operations form a loop: test results and fatigue signals should become the hypothesis for the next production brief.
Creative testing should reduce uncertainty
A creative test should teach you what to make next. Finding this week’s highest CTR is not enough.
Write one hypothesis before launch:
Showing
[message or execution]to[audience]will improve[primary metric]compared with[control creative].
Examples:
- Leading with price will produce a higher purchase conversion rate than leading with product features.
- Opening with a use case will improve three-second video retention compared with opening on a logo.
- Customer proof will reduce new-customer CPA compared with feature-led messaging.
Without a hypothesis, ten ads produce ten performance rows but little reusable knowledge. With a hypothesis, even a losing creative can improve the next brief.
Separate concept tests from element tests
These tests answer different questions.
Concept tests
Concept tests identify which persuasion angle resonates:
- Save money
- Save time
- Customer proof
- Problem awareness
- Competitive comparison
The video, copy, and visual treatment may all change across concepts. The result tells you which complete execution performed better. It does not isolate the element responsible for the difference.
Element tests
Element tests refine a proven concept by changing one primary variable:
- Opening hook
- Thumbnail
- Headline
- CTA
- Video length
If you need a causal answer, change one main variable and keep the rest comparable. The official Google Ads experiments guide recommends defining a clear hypothesis and success metric before an experiment, then testing one variable at a time.
A practical sequence is to test broad concepts first, then refine hooks and executions inside the winning concept. Use the 3-second hook guide when you are ready to refine the opening execution.
How many creatives should you test at once?
Use a budget constraint instead of a universal benchmark:
Concurrent creative slots = Test-batch budget ÷ Decision budget per creative
You can estimate the decision budget like this:
Decision budget per creative = Target CPA × Expected conversions required before review
Suppose your target CPA is $30. You plan to review a creative after roughly five expected conversions, so the working decision budget is $150 per creative. A $600 test batch can support four concurrent creative slots.
| Calculation | Example | Meaning |
|---|---|---|
| Target CPA | $30 | Predefined efficiency target |
| Expected conversions per creative | 5 | Working threshold before the first review |
| Decision budget per creative | $150 | $30 × 5 |
| Test-batch budget | $600 | Total budget for this round |
| Concurrent creative slots | 4 | ⌊$600 ÷ $150⌋ |
This is illustrative data, not a claim that five conversions prove a statistical winner. Accounts with low volume, delayed conversions, or high variance need more time and larger samples.
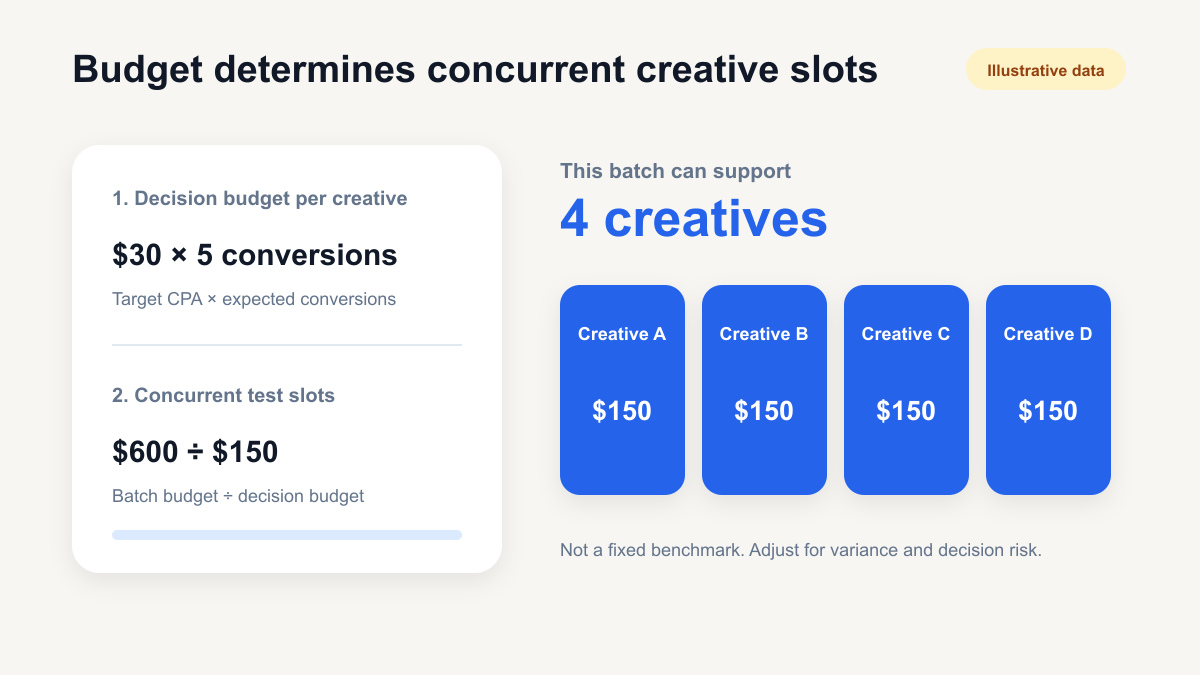
In this example, a $600 batch divided by a $150 decision budget creates four concurrent test slots.
The principle matters more than the example: do not choose the creative count first and divide the budget into fragments. Estimate the evidence needed for a decision, then calculate how many assets the batch can support.
What this calculation does—and does not—answer
This is an operational capacity formula. It estimates how many creatives can receive a minimum decision opportunity within the available budget. It does not calculate the statistically required sample size or replace a platform experiment's power calculation.
- If you do not have a target CPA, use an observed internal baseline or an explainable break-even threshold and label the result exploratory.
- If conversions are delayed, check whether the reporting window has matured before deciding.
- Large delivery differences can make the comparison unfair even when the planned slot count is reasonable.
- When you need a causal winner, follow the platform experiment's guidance for duration, sample, and statistical power.
With a small budget, reduce hypotheses before reducing evidence
A small account can easily create an unmanageable combination:
- Four concepts
- Two videos per concept
- Three headlines per video
That produces 24 combinations. Giving every combination comparable evidence requires substantial spend.
Use sequential rounds instead:
- Compare two or three concepts.
- Test two or three hooks inside the winning concept.
- Refine the winning hook with thumbnail or CTA variations.
You will explore fewer combinations per round, but every round produces clearer learning.
Lock five decisions before launch
1. Test hypothesis
State what you expect to learn in one sentence.
2. Primary decision metric
If the campaign goal is revenue, prioritize purchase CPA or ROAS. Use CTR, CPC, and watch metrics to diagnose why performance changed.
A high CTR can coexist with weak purchase performance. The creative may attract curiosity rather than qualified demand. Do not declare a winner on CTR alone.
3. Comparable conditions
Keep the audience, optimization event, bid strategy, period, and landing experience as consistent as practical. Changing both creative and targeting prevents a clean interpretation.
4. Minimum observation rule
Define a minimum observation period and two exit paths before launch. Run the first read when either adequate conversion evidence is available or the predefined decision-spend cap is reached. This OR rule prevents a zero-conversion asset from running forever without letting the team rewrite the threshold after seeing the result. Hold the decision when delivery is too low or conditions are not comparable.
5. Post-test action
Define winner, hold, and loser criteria—and the next action for each state.
The highest-spend creative is not always a fair winner
Automated campaigns may allocate more delivery to creatives predicted to perform well. If Creative A spends $500 while Creative B spends $50, comparing total conversions alone is misleading.
Check:
- Did each creative meet the minimum observation rule?
- Was the difference in impressions or spend extreme?
- Did both creatives run against comparable audiences and optimization goals?
- Has conversion delay matured?
- Could a small-sample rate difference be noise?
When you need a causal comparison, use a platform experiment. Meta Ads Manager supports A/B test setup after campaign publication. Google Ads Experiments can split budget or traffic between a base and experiment. TikTok Ads Manager Split Testing keeps other variables stable, divides the audience into two groups, and gives each group exclusive exposure to one version.
Multiple ads inside a normal optimized campaign can support operational decisions, but they are not equivalent to a randomized A/B test. Use the A/B testing guide when you need sample-size and significance rules.
Classify the result: winner, hold, or loser
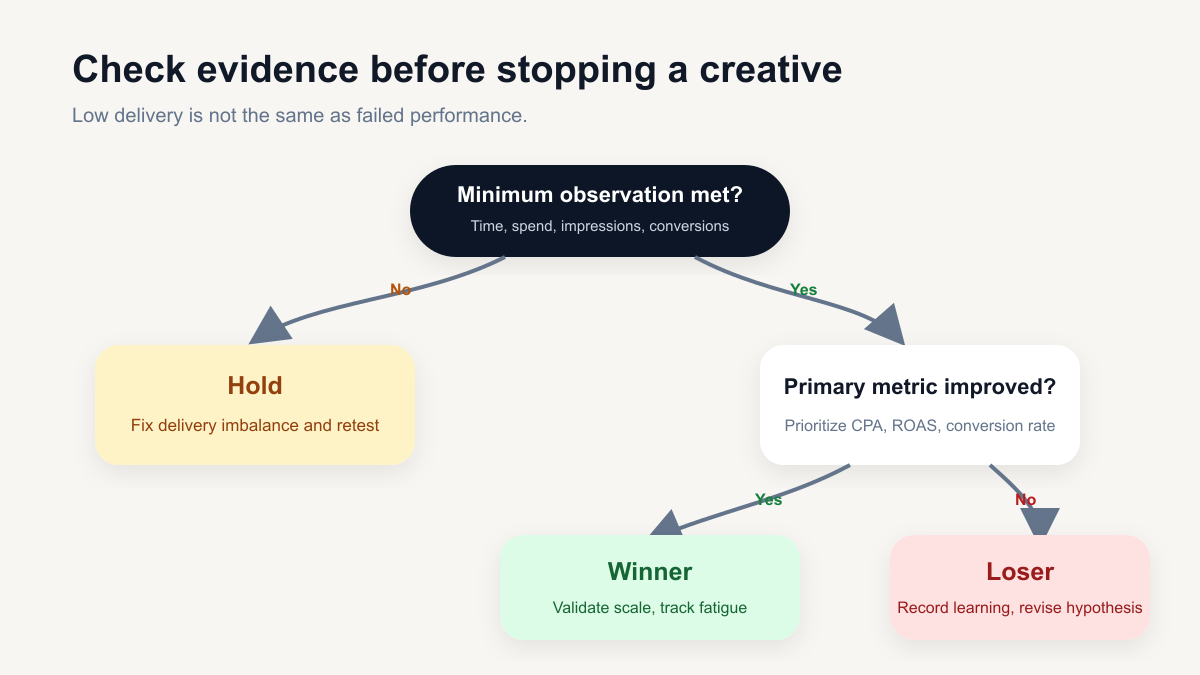
Check the minimum observation rule first, then use the primary metric and comparison quality to select a decision and next action.
| Decision | Evidence | Next action |
|---|---|---|
| Winner | Minimum period, adequate conversion evidence, and primary metric improvement | Increase spend gradually and validate again |
| Hold | Period not met, immature conversions, or uneven delivery | Fix the condition and rerun the test |
| Loser | Minimum period and spend cap reached, with comparable delivery but a missed primary target | Record the failure reason and revise the hypothesis |
Winner
- Beats the control on the primary business metric
- Meets the minimum period and conversion-evidence rule
- Diagnostic metrics provide a plausible performance explanation
- Deserves validation at higher spend
A winner is not permanent. It is a candidate for the next validation stage.
Hold
- Direction looks promising but the sample is thin
- CTR is strong but conversion data is immature
- Performance appears only in one placement or audience
- Delivery imbalance prevents a fair comparison
Do not force every inconclusive result into the loser bucket. Fix the test condition and run it again.
Loser
- Passes the minimum period and uses the predefined decision budget but misses the primary target
- Produces clicks but repeatedly attracts low-quality conversions
- Creates a mismatch between the ad promise and landing experience
- Provides no signal supporting the hypothesis
This is an operating decision under the available budget, not proof of causal inferiority. Record the reason. “Testimonial creative lost” is too vague. “A testimonial without a product demonstration attracted clicks but failed to improve new-customer purchase rate” is reusable knowledge.
Your test log becomes the next creative brief
Track at least:
- Launch date
- Channel and campaign
- Concept
- Hook type
- Format and length
- Offer
- Audience
- Spend, impressions, clicks, conversions, and revenue
- Decision: winner, hold, or loser
- Next creative hypothesis
Without a test log, teams produce new assets every week but repeat old mistakes. A structured log reveals which audience, hook, offer, and format combinations deserve another round.
A winning creative still needs an exit plan
Performance can decline as spend increases and the same audience sees a winner repeatedly. A falling CTR alone does not prove fatigue; placement mix, targeting, competition, and budget allocation may also have changed.
Use the four-step ad performance diagnosis to separate creative fatigue from placement, targeting, and funnel changes. Even when fatigue becomes more plausible, avoid replacing every winner in one move.
Google Ads Demand Gen creative refresh guidance says to add new assets before removing old ones, then confirm that a removal candidate has had at least 14 days to ramp and is underperforming the goal. Keep strong assets and refresh only a portion. Its App campaign creative asset guidance similarly recommends gradual replacement of low-rated assets after learning.
TikTok's performance creative guidance offers three to five assets per ad group as a starting point while explicitly noting that every campaign differs. Treat that as platform guidance, not a universal quota, and replenish the existing ad group when sustained decline or weak new reach appears.
The safer sequence is keep assets that still perform → add new variants first → observe enough data → replace the weaker portion.
Launch checklist
- Write one test hypothesis.
- Separate concept testing from element testing.
- Choose one primary decision metric.
- Calculate creative slots from test budget and decision budget.
- Keep audience, bidding, landing page, and period comparable.
- Define the minimum observation rule before launch.
- Define winner, hold, and loser actions.
- Save the result and next hypothesis by creative ID.
- Prepare to monitor fatigue after a winner scales.
After several rounds the question becomes what worked repeatedly — that is ad creative performance analysis — and when a fresh test on past creatives is not an option, ad creative regression picks it up.
Conclusion
The useful question is not “How many creatives should we make?” It is “How many hypotheses can this budget evaluate fairly?”
Divide the test-batch budget by the decision budget required per creative. Lock the hypothesis and primary metric before launch. Classify results as winners, holds, or losers. Then monitor fatigue and feed the learning into the next production cycle.