You open the dashboard one day and CPA has jumped. Your stomach drops. But before you touch anything, ask one question: is this a real anomaly, or just that day's noise?
First choose: a sudden spike, or a sustained performance drop?
- A number jumped today or only over the last few days: start here. Confirm that it broke outside the normal range before decomposing the cause.
- CPA, CTR, or conversion rate has worsened across several periods: go to the four-step ad performance diagnosis. It moves from measurement to scope, mix versus efficiency, and then the funnel.
A one-day anomaly and a continuing decline should not get the same response. Confirm the signal first; move to the deeper diagnosis only when the problem persists.
Daily numbers wobble by nature
Day-to-day performance always swings. Weekend and day-of-week effects, the luck of a low-sample day, billing lag, yesterday's conversions posting today. Mistake this normal in-range wobble for an anomaly and act on it, and you can reset the platform's learning and make things worse.
So you need a definition of "spiked" — not the gut feeling that it rose since yesterday.
The bar for an anomaly is "how far past the usual"
A simple method that works in practice is a moving average ± standard deviation band. Take the recent N days' mean and spread as the baseline, and flag today as an "anomaly candidate" only if it breaks the band (say mean ± 2σ). Inside the band does not prove normality: small sustained shifts, limited samples, or a contaminated baseline can go undetected.
Set up this way, you react not to "CPA rose 20% from yesterday" but only to "it broke past the normal range." Most wasted interventions get filtered here. For metrics with strong day-of-week swings, compare like days or remove the day-of-week effect for more accuracy.
A worked example
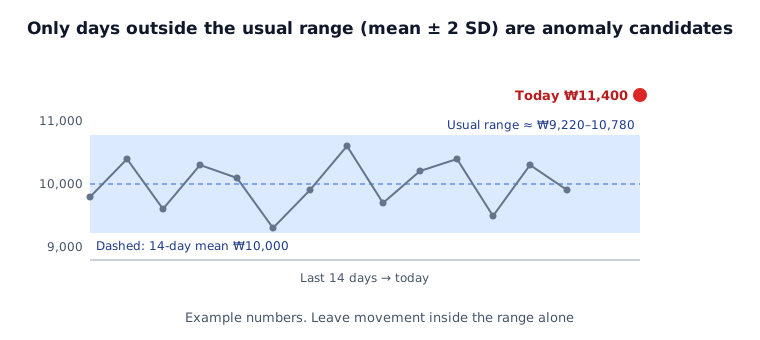
Say CPA moved between ₩9,300 and ₩10,600 over the last 14 days. The mean is ₩10,000 and the standard deviation is about ₩388. A mean ± 2 SD band puts the usual range at roughly ₩9,220 to ₩10,780.
- If today's CPA is ₩10,600, it is 7% above the previous day (₩9,900) but still inside the range. Keep watching.
- If today's CPA is ₩11,400, it is outside the range. Flag it as a candidate and move on to the breakdown below.
If levels differ by weekday, build the range from the same weekday. In an account where weekend CPA always runs higher, a weekday-based range flags every Saturday. With only a few dozen conversions a day, CPA itself swings widely, so group several days together or widen the range.
If it is an anomaly, decompose next
Once a real anomaly is confirmed, split the cause. Performance changes for two broad reasons.
- Volume — spend or impressions changed the total.
- Efficiency — conversion rate or unit cost itself got worse.
Mix the two and you stop at "CPA rose." Split volume and efficiency by channel, campaign, and creative with performance variance decomposition (PVM), and you land on the actual culprit, like "channel A's efficiency dropped and dragged the whole thing down." Because it decomposes with no residual, the parts add up exactly to the whole.
Where to look
The operations dashboard's anomaly tab auto-flags days that break the band, and performance variance detection decomposes the observed change without a residual; this does not prove causality. Upload an efficiency CSV or connect a Google Sheet. Where public-sheet import is enabled, refresh with the fetch-latest button. It is not automatic synchronization.
If the decline is sustained over days rather than a single spike, ad performance drop is the right sequence; if it is unclear which metric to read first, performance marketing metrics lays out the chain. If it is unclear which analysis your data can even support, marketing data analysis is the starting point.
Limits of this approach
Anomaly detection tells you "this looks off" — it doesn't prove the cause. Even a day that broke the band may have outside factors mixed in (a competitor promo, seasonality, a landing outage). Use the spiked number only as a starting point for investigation, and check what actually happened that day before deciding.
If the anomaly proves to be a repeating decline, the next question is what to fix first. Continue with the four-step ad performance diagnosis to narrow measurement, channel, mix, and funnel causes in order.