When performance drops, it is tempting to choose a method first: “Should we run MMM?” or “Is this an A/B test?” That can force the data into a method it cannot support. A daily campaign export can find an operating problem quickly, but it cannot prove the net causal effect of advertising by itself.
Choose the first analysis from two things: the decision you need to make and what one row represents. Get those right, and you can reach an action without starting with the heaviest model.
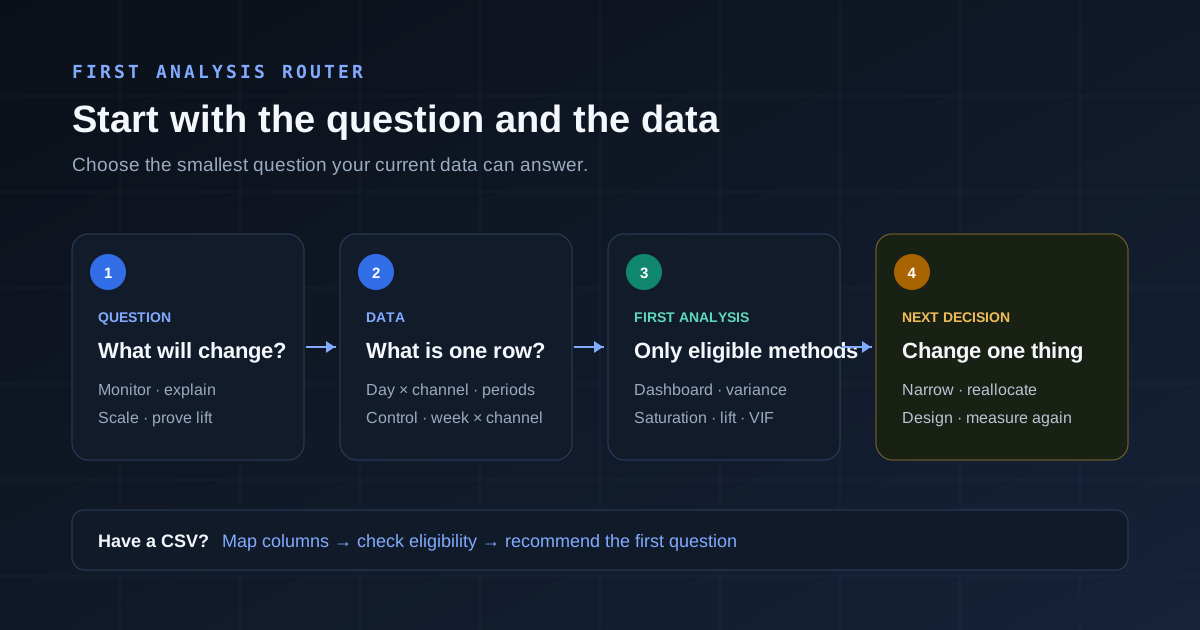
The short answer: first analysis by data shape
| Data you have | First question | Start here | Then |
|---|---|---|---|
| Daily spend and conversions | Where is performance moving? | Operations dashboard | Narrow the channel and period |
| Campaign results before and after | Why did CPA or ROAS change? | Performance variance | Separate volume, efficiency, and mix |
| Daily channel spend at several levels | How far can we scale? | Saturation diagnosis | Budget allocation |
| Control and test aggregates | Which variant won? | A/B experiment analysis | Apply and measure again |
| Holdout market, period, or control | Did ads create net lift? | Incrementality analysis | Budget from incremental value |
| 52+ weekly observations by channel | What are the long-run responses? | VIF diagnosis | MMM after collinearity checks |
| Search-term report | Which terms and CPT bids need action? | ASA Keyword Finder | Exact, negative, and bid actions |
| Daily creative delivery and conversion data | Which creative is fatiguing? | Creative analysis | Replace or scale candidates |
This is not a ranking by sophistication. It is a map of what your current data can answer. If there is no control, start with an operating diagnosis instead of imitating an incrementality study.
1. Start with monitoring when the number looks wrong
If CPA jumped today or conversions fell, you usually do not need a model first. Date, spend, and installs or conversions are enough to inspect the recent trend and channel split. Impressions and clicks add CPM, CTR, and conversion rate to the investigation.
The goal is not to prove a cause. It is to reduce the search area: reporting delay, one channel, or the whole funnel. Upload a CSV at Start with my data, and the service checks the columns and date coverage before showing analyses you can run now.
2. Split a before-and-after change into volume, efficiency, and mix
An increase in total CPA does not mean every channel became less efficient. Total CPA can rise because a more expensive channel took a larger share of conversions even when each channel's CPA stayed flat. A before-and-after decomposition separates volume, within-channel efficiency, and channel mix.
That explains what moved together. It does not prove why a budget moved or whether a creative change caused the result. Make one operational change at a time and measure again.
3. Use marginal efficiency for a scaling decision
Current average CPA is not enough to decide where to add budget. You need to know how many additional conversions followed higher spend. That requires meaningful spend variation within each channel. A channel funded at nearly the same level every day cannot support a stable response curve.
Check saturation first, then send only channels with headroom into budget allocation. “Efficient now” and “efficient for the next dollar” are different questions.
4. Make causal claims only when the design supports them
A/B testing and incrementality answer different questions. A/B compares variants. Incrementality compares advertising with a credible no-ad counterfactual.
Without a control, holdout market, or off period, observational performance does not justify “ads caused the lift.” Describe associations and operating signals honestly, then design a control for the next campaign. The strength of the conclusion should match the design.
5. MMM is not the final boss; it has different requirements
MMM is not last merely because it is heavy. It answers a different question when you have a sufficiently long weekly panel of channel spend, outcomes, and controls such as seasonality and promotions. The entry recommendation treats 12–51 weeks as exploratory and checks its decision-period threshold from 52 weeks. Meeting that threshold does not pass input quality, independent variation, identification, or time-ordered validation. If channels move together, their contributions are difficult to separate.
Run VIF diagnosis before MMM. High VIF is a signal to combine channels or redesign the period and variables. A model producing numbers does not make channel contribution identifiable.
If the number spiked for a single day, go to campaign anomaly detection; if conversion leaks at one stage, conversion rate optimization; if users do not stay, retention cohort analysis.
What can one file actually answer?
Suppose a daily file contains date, channel, spend, clicks, new paying customers. This is a workflow example, not observed campaign performance.
- Validate the input: confirm that customers are deduplicated and new, dates and currency align, and recent conversions have matured. A column name alone does not make purchases, installs and signups the same outcome.
- Reach a first result: check mapping and eligibility at Start with my data. Divide total cost by total customers and narrow the channel and period. Do not average row-level CPAs.
- Explain an observed change: with two comparable periods, use Performance variance to inspect mix and efficiency contributions. Align periods and conversion definitions first.
- Keep the unanswered question: this file contains no randomized assignment or no-ad control. It can help locate a decline, but does not establish how many customers would disappear if advertising stopped.
A low MMM VIF also does not remove omitted confounders. Review controls and model assumptions separately, as described in Google Meridian's required causal assumptions. Record unresolved conditions alongside the result before making the next decision.
If you do not know the tool, start with three questions
No file yet? Use Diagnose performance to choose the symptom, scope, and data shape. If you have a CSV, Start with my data is faster: automatic column mapping → analysis eligibility → recommended first question. Uploaded data stays in the browser and is not sent to a server.
The best analysis is not the most complex one. Start with the smallest question your data can answer, check whether the result changes a decision, and deepen the analysis only when needed.
For repeated decisions, record observations, hypotheses and actions in the weekly marketing report worksheet. If preparation is the bottleneck, compare the paths in BigQuery, Sheets and analysis-ready CSVs.