If Android is fine but only iOS looks cut in half, suspect measurement before the campaign. After the "Allow tracking?" prompt (ATT), precise user-level tracking on iOS got hard, and you now read performance through Apple's limited aggregate frame, SKAdNetwork (SKAN). Miss this structure and you'll kill a perfectly good iOS campaign on the numbers alone.
Here's what changed and what to judge by inside it.
ATT: no consent, no identifier
If a user declines the ATT (App Tracking Transparency) prompt, you can't use the IDFA (ad identifier). That restricts IDFA-based cross-app attribution; it does not prohibit all first-party measurement. The lower the consent rate, the smaller the sample where precise measurement is even possible.
So the ATT consent rate itself became a metric to manage. When and in what context you show the prompt (priming — showing value first, then asking) changes consent a lot. Raise consent and more of your sample becomes measurable — iOS performance starts to "reappear."
One point that trips people up: declining ATT restricts cross-app tracking, not ad delivery or every form of first-party measurement. Ads still serve to those users and installs still happen. You simply cannot confirm at the user level which campaign earned them.
Did the numbers arrive late, or did performance really drop?
SKAN: anonymous, delayed, limited signal
SKAN is Apple's alternative. It has three traits.
- Anonymous, aggregate — it aggregates only at the campaign level, not per user.
- Delayed — the conversion signal arrives days later, and with a randomised delay on top.
- Limited information — you must compress early behavior into a narrow value, the conversion value.
So conversion-value design became the core of iOS measurement — deciding which post-install action (signup, tutorial complete, first purchase), within a few days, gets packed into that narrow value. Get this design wrong and the platform learns on a bad signal, and iOS optimization drifts off entirely.
What actually changed in SKAN 4
This is the part most people arrive here searching for, so it gets its own section. Three things differ from earlier versions.
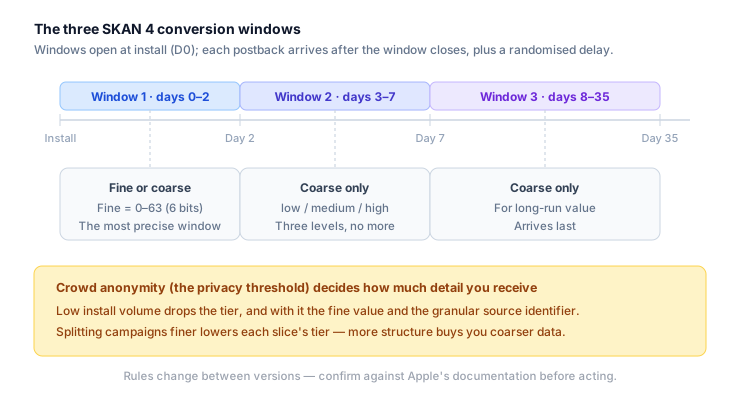
One: three measurement windows instead of one. Previously you effectively got a single postback shortly after install. SKAN 4 can return a postback for each of three windows — days 0–2, 3–7, and 8–35. That creates room to observe late-firing behavior such as retention or subscription conversion.
Two: a coarse value arrived. The precise fine value (0–63) comes only in the first window, and only when volume conditions are met. The rest is a coarse value with three levels: low, medium, high. The resolution of the second and third windows is therefore quite blunt. Designing detailed LTV bands there just collapses them into three buckets.
Three: the privacy threshold (crowd anonymity) governs how much you get. This is what most often bites in practice. When install volume is small, Apple reduces what it returns so individuals cannot be re-identified. At a low tier, neither the fine value nor the granular source identifier arrives.
Splitting campaigns can leave fewer observations in each report segment. That alone does not establish a lower Apple tier. Check versions, source identifiers and returned-value distributions before deciding whether consolidation serves the operating objective.
Exact tier conditions and per-window return rules change between versions, so confirm against Apple's SKAdNetwork documentation and the multiple conversion windows reference before designing.
Common mistakes in conversion-value design
What you pack into that narrow value is the whole game, so mistakes here become optimization quality directly.
- Trying to include every event. Six bits is 64 slots; slicing them finely shrinks the volume behind each slot and raises noise. Narrow to what connects to your business KPI.
- Encoding behavior outside the window. The first window is days 0–2. An average purchase on day 5 does not exclude earlier purchases; check the fraction within the first two days. Look at your actual conversion-delay distribution before choosing.
- Changing the design often. Remapping makes data before and after mean different things, breaking comparison. If you must change it, record the date and never blend the periods.
- Dropping raw revenue in. Revenue is continuous and has to be bucketed, and tight buckets run out of slots fast. Splitting only the few bands that matter works better.
So what do you judge by
With user-level blurred, the aggregate and incrementality lens carries more weight.
- Rather than trusting platform reports at face value, use incrementality analysis to see "what the ad actually created."
- Methods like MMM, which estimate channel contribution from aggregate data without user identity, rose in value.
Aggregate analysis also needs a valid design and identification. An on/off before–after difference alone is not causal evidence; check controls, seasonality and concurrent changes. Detailed responses are in the iOS privacy · ATT · SKAN guide.
Next generation: AdAttributionKit
Apple introduced AdAttributionKit (AAK), the successor to SKAdNetwork. Apple supports interoperability between the frameworks. Choose implementation based on OS, platform and MMP support. It adds dimensions SKAN lacked, such as re-engagement attribution and alternative app marketplace support. See the AdAttributionKit documentation for specifics, and follow platform and MMP announcements for migration timing.
Continue with SKAN versus MMP attribution to compare measurement systems, and SKAN conversion-value design to map events into values.
Align these fields before comparing reports
This is a diagnostic example, not an account result. Comparing installs viewed on Monday with postbacks received through Friday mixes performance differences with arrival delay.
| Comparison | Align first | Unsupported conclusion |
|---|---|---|
| Install date and postback receipt date | Grouping date and maturity of each window | Fewer receipts = fewer installs that day |
| Fine, coarse and missing values | Window, version, return conditions and mapping version | Missing value = zero purchases |
| Platform, MMP and SKAN totals | Attribution window, redownloads, modeling and deduplication scope | Report gap = missing installs |
| SKAN and AdAttributionKit | Actual implementation, interoperability and deduplication | Adding both totals = new customers |
Record the report period, window and mapping version, then follow the SKAN versus MMP comparison. Apple's multiple conversion windows and AdAttributionKit interoperability documentation describe return conditions. These checks do not reconstruct unobserved revenue or establish causality.
Try this today
Open your iOS campaign report and check two things.
First, how far apart the platform console's iOS installs and your MMP or SKAN aggregate sit. The gap is not the missing volume. Align attribution windows, deduplication, modeling and delay first. Its size alone cannot distinguish missing measurement from a real performance decline.
Second, pull up your conversion-value mapping and count the volume behind each value. If many slots are empty, check behavior distribution, missingness and return conditions before considering consolidation. Merge slots until each one carries enough volume to support a decision.
Which SKAN 4 window to open in what order is in SKAN 4 migration, and why media, GA4, and MMP numbers disagree is in attribution data mismatch.
Limits of this approach
SKAN's rules change by version, and delay and sample issues make the numbers unstable. The whole team has to share the premise that iOS performance is "the best estimate within a limited signal," not precise measurement. Overreact to a single console number and toggle campaigns on and off, and you'll chase a signal that isn't there and shake real performance in the process.
Treat SKAN-based ROAS with particular care. It is an approximation of revenue encoded into a narrow value, and revenue past the measurement window is never captured at all. Different missingness, buckets and maturity can distort campaign rankings too.