About two weeks after a brand campaign wraps, the readout meeting gets booked. Three slides in, someone asks the only question that matters:
"So what did this earn?"
That is the cold moment, because the conversion count in the report is embarrassing. Six figures of spend, and the campaign account shows twenty conversions. Walk in with that number and next quarter's budget disappears.
The instinct is to defend it — bring impressions, bring reach. Nobody believes those. The actual problem is upstream: the wrong number was being defended in the first place.
The short version:
A brand campaign is not evaluated on clicks. It is evaluated on a time series.
Why nothing lands in the brand campaign account
Performance campaigns run in one straight line. See the ad, tap it, install, pay. The conversions pile up inside that account.
Brand campaigns do not behave that way. Someone sees the ad and does not tap. A few days later they remember, search your brand name directly, and convert.
Where does that conversion get recorded? Under brand search or direct traffic. Nothing lands in the brand campaign account — and the brand search campaign gets praised for great efficiency, when the demand it harvested was created by the brand campaign.
Click-based reporting alone cannot establish the total effect. Cut budget on that number and you lose the ability to see the effect at all.
Choose the outcome metric
Use whichever of these you have.
- Brand search volume — visits from searches on your brand or product name. Response timing and noise depend on the product, search volume, and measurement.
- Direct traffic — typed URLs, direct app opens. A lagging indicator of awareness.
- Non-ad-attributed signups or installs — conversions no network claimed.
If you have all three, start with brand search. It is the behavior closest to the ad exposure, so its signal-to-noise ratio is best.
The pre-period trend becomes your baseline
The point is to construct "what would have happened without the campaign." With no control group, the pre-period trend plays that role.
- Gather weekly or daily pre-campaign observations. Eight weeks is an example; seasonality and design may require a longer history.
- Fit a trend over that window and extend it forward. That extension is a model-based counterfactual estimate, conditional on the pre-period relationship remaining valid.
- Sum the gaps between actual values and the extended line — that is the estimated lift.
This design is called an interrupted time series. Brand campaign incrementality computes the trend and the uncertainty interval from three columns: date, outcome, and campaign status.
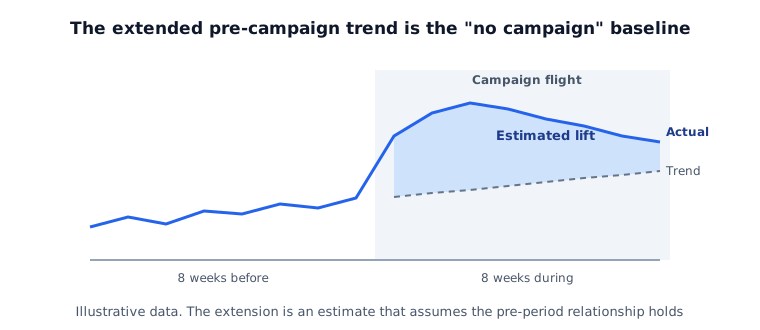
One caution. Series like brand search volume are strongly linked week to week. Ignoring that and fitting an ordinary regression produces intervals far narrower than reality, which makes a weak result look certain. Use an interval that accounts for autocorrelation.
What this number can and cannot say
It can say: brand search rose this much relative to the pre-period trend, and whether that rise exceeds normal variation.
It cannot say: that the entire rise came from the campaign. A product launch, PR, a competitor's stumble, or a seasonal peak in the same window all mix in.
So when you write the result, list the other events in the window. That is not defensive hedging — it is the information you need to decide whether to run the campaign again.
Set up the next campaign better
The strongest design is to hold out a region or audience. Excluding a few regions instead of going national creates a same-period comparison group, and shared shocks cancel only under appropriate comparability assumptions; check unequal shocks and spillovers.
Put one line in the next brand campaign brief: "keep N regions unexposed." That single line produces a much better answer to next quarter's "what did it earn." Regional holdouts require inference at the regional assignment level. Do not enter regional aggregates as independent people in the binomial control-group method of incrementality analysis.
The general problem of separating what advertising actually caused is covered in incrementality measurement, and click-free media like TV get the same treatment in measuring offline ad impact online.
Eight weeks is a preparation example, not a sufficiency guarantee. Required history depends on autocorrelation, seasonal cycles, observation frequency, and post-period length. A before/after difference alone is not a causal effect.
Try this today
Whatever your outcome metric is — brand search volume, direct traffic — secure pre-launch observations, not only recent weeks. Assess whether eight weeks is sufficient for the design and seasonality; disclose the baseline limitation if historical tracking is unavailable.
Put one line in the next brand campaign brief: "leave N regions unexposed."
That single line changes a lot. Instead of going national, holding out a few regions creates a same-period comparison group. Check whether seasonality, PR, and competitor changes affected groups comparably, and whether spillovers occurred. Holding out regions does not automatically cancel these factors. Next quarter's "what did it earn" gets a much firmer answer.
If the calculation is tedious, upload your existing report CSV. It fits the pre-period trend, measures how far actuals rose above it, and returns an interval that accounts for autocorrelation. Data is processed in your browser and never sent to a server.
A modest-looking brand campaign number is not necessarily a modest result. It may simply be a result that does not live in that account.