Offline advertising has no clicks. So measurement usually ends either in vague impressions, or in the opposite error: crediting the entire lift during the flight to TV.
The way out of both is to compare exposed and unexposed windows as a time series.
What to look at
Offline advertising leaves roughly three traces online.
- Brand search volume — people see the ad and search the name. Response timing varies by product and measurement.
- Direct traffic and direct app opens — people who already know you arrive straight away.
- Non-ad-attributed installs or signups — conversions no network claimed.
Do not read performance-channel conversions directly. If digital budget rose during the TV flight, that increase may belong to digital.
Read two time scales
Long scale (weekly): take at least eight pre-flight weeks as a baseline and compare actuals during the flight. Brand campaign incrementality computes this from date, outcome, and campaign status.
Short scale (hourly): check whether traffic in the 15–60 minutes after a spot deviates from the usual level for that weekday and hour. This spike is weak causal evidence on its own, but it cross-checks whether the long-scale estimate points the right way.
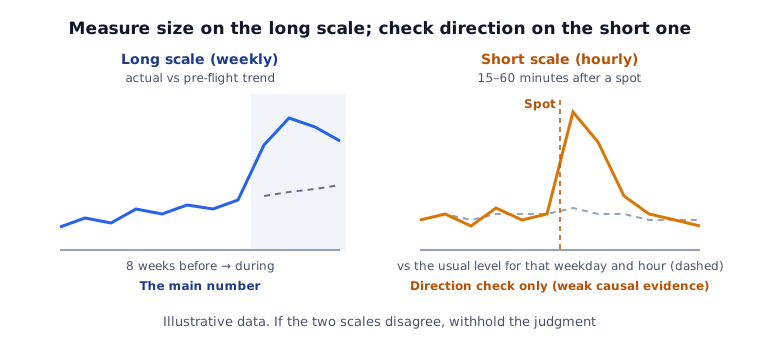
If the two scales disagree, collect more data instead of concluding.
When digital is mixed in
This is the most common and the hardest case. If digital budget rose in the same week TV started, the data only shows that both moved together. Forcing a split produces numbers without evidence.
The check is simple. Put channel spend into VIF multicollinearity check. If the two channels moved nearly in lockstep, VIF comes back high — and that is the signal that this data cannot separate contribution. Channel-level contribution estimated in that state is not usable as an allocation basis.
Design the next flight
- Split by region. Leaving some areas unexposed creates a same-period comparison group. Offline buys are region-addressable, so this is often easier than for digital.
- Hold digital flat. Not raising digital during the flight makes separation far easier.
- Accumulate pre-period data. A short baseline widens the interval until nothing can be said.
Following even one of the three changes next quarter's answer.
Eight weeks is a preparation example, not a sufficiency guarantee. Required history depends on autocorrelation, seasonal cycles, observation frequency, and post-period length. A before/after difference alone is not a causal effect.
Try this today
Before the next flight starts, pull at least eight weeks of brand search volume and direct traffic and park it somewhere. A baseline cannot be built after the fact, and without one the interval stays so wide that no result is sayable.
Ask the media team one question: can we leave any region unexposed? Offline buys are region-addressable, which makes this far easier than it is in digital. The number of regions must follow a design and power assessment. One or two regions do not guarantee adequate inference; inspect balance, spillovers, and concurrent changes.
The same time-series approach for click-free media appears in measuring brand campaign lift, and the bar for reading the result as incremental is in incrementality measurement.
Limits of this approach
Everything above estimates a counterfactual from a trend, not from a randomised comparison. When a product launch, a PR moment, or a seasonal peak lands in the same window, this design cannot separate them from the flight.
So write the other events in that window down alongside the number. That is not hedging — it is the information you need in order to decide whether to buy the same flight again. A result read without knowing "PR also landed that month" sets an expectation the next quarter will not meet.
If the calculation is tedious, upload your report CSV. The pre-period trend, the gap above it, and an interval that accounts for week-to-week autocorrelation all get computed in your browser, and nothing is sent to a server.