While you're tweaking creative and bids to lower CPI, the store page where users actually decide to install has often sat untouched for months. A tap on your ad still installs on the store, so if store conversion is leaking, ad spend leaks along with it.
ASO (App Store Optimization) plugs that hole and grows organic installs on top. It has two axes: getting found (visibility) and getting installed (conversion).
Why this comes before paid work
Start with how ASO connects directly to ad efficiency. Everyone who clicks an ad still passes through the store page, which makes store conversion rate a multiplier on all your paid performance.
In numbers (illustrative): ads drive 10,000 product page views, and at 30% conversion that is 3,000 installs. Raise conversion to 40% and the same spend produces 4,000. Installs up 33%, CPI down 25%.
This example holds spend and page views fixed. Traffic intent and custom product pages may differ by channel, so do not apply one page's improvement equally to every channel.
1. Found — keywords
For your app to appear when someone searches, the store has to associate you with that keyword.
- App name and subtitle — the strongest signal. Weave in core keywords naturally.
- Keyword field (iOS) / description text (Android) — this is where related search terms go.
- The rules differ by store — iOS uses a dedicated keyword field; Google Play matches words in the description. Fill them according to each store's policy.
Judging keywords by rank alone creates an illusion. Traffic depends on search volume, actual visibility, and click rate at that position. Multiplying search volume by the numerical rank is not a valid formula. Check search intent and observed install conversion together.
Narrowing the candidate list in this order wastes less time.
- Words that already describe you — start from terms already in your app name, subtitle, and description. The store needs a reason to associate you with a word before it will rank you for it.
- Words your competitors use — scanning the names and subtitles of apps solving the same problem reveals the search language of that category.
- Mid-tail terms with clear intent — "shared budget app" rather than "budget". Lower volume, but you can actually rank, and the people who arrive install at a higher rate.
You do not need to repeat one keyword across the name, subtitle, and keyword field. Every duplicated slot is a keyword you could not fit.
2. Conversion — the store page
Ranking in search is pointless if nobody installs. The conversion rate from impression to install is the other half of ASO.
- Icon and first screenshot — what shows in the search results list. This decides whether people tap: the CTR.
- Screenshot flow — put the core value in the first two or three. Most users decide by then.
- Rating and reviews — a low star rating filters you out no matter how good everything above is. Rating management is ASO too.
This is the same principle as CTR and CVR diagnosis: the chain of "see → get pulled in → act."
Both stores ship experiment tooling (Product Page Optimization on the App Store, store listing experiments on Google Play) that lets you A/B test icons and screenshots on real traffic — far better than picking by taste. The usual A/B testing rules still apply: stop early on a peek at interim results and you will mistake noise for a winner.
Store conversion is not one number
Collapsing conversion into a single rate stops the diagnosis right there. The store funnel has at least three layers.
| Layer | App Store Connect column | Meaning |
|---|---|---|
| Impressions | Impressions | Times your app appeared in search, charts, or featured lists |
| Product page views | Product Page Views | Times someone tapped through to your product page |
| Installs | Total Downloads | Times someone actually downloaded |
These two ratios are operational derivatives. Apple’s official conversion rate uses downloads and pre-orders over unique-device impressions; Impressions also include product page views. Views and downloads are not linked steps for identical users, so downloads divided by page views is not the install probability of a page visitor. Align unique-device versus event counts and redownload definitions. Apple metric definitions.
The operational ratios are:
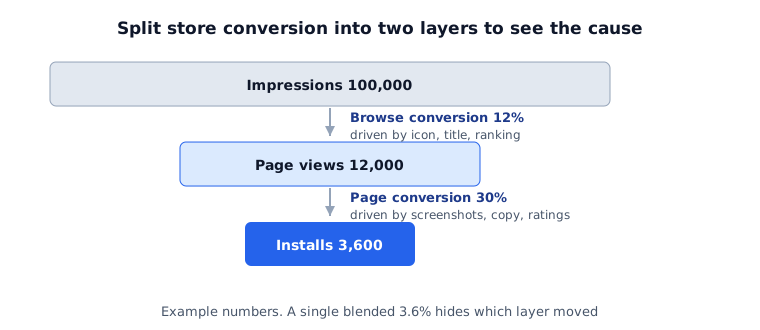
- Browse conversion = product page views ÷ impressions — driven by the icon, app name, and first screenshot thumbnail. The question is whether people tap in the list.
- Page conversion = installs ÷ product page views — driven by the screenshot flow, description, and ratings. The question is whether people install once they are on the page.
With 100,000 impressions, 12,000 product page views, and 3,600 installs, browse conversion is 12% and page conversion is 30%. If installs drop next month while this ratio stays at 30%, check view volume and source mix first. That alone does not rule out screenshot effects or identify the icon or ranking as the cause. Reading the two layers as a single 3.6% erases that distinction entirely.
Conversion dropped — did it get worse, or did the mix change?
This is the mistake ASO work repeats most often. Store traffic converts very differently by source. Someone who searched your exact app name almost always installs; someone who drifted in from a chart or a featured list installs far less often.
So an overall drop from 30% to 26% has two readings.
- Rate decline — conversion actually fell within each source. Page quality, traffic intent, competition and measurement changes are possible explanations.
- Mix shift — each source converts exactly as before, but low-converting sources (browse, referral) now make up a larger share.
Read case 2 as case 1 and you rebuild screenshots that were never broken. The way to separate them is to split by source and check whether each source's own rate moved. Decompose the total change into "rate change within sources" and "share change across sources" and the two parts add up with no residual left over.
3. Relationship with paid
Push traffic with paid UAC or ASA and store rank rises, which lifts organic installs too — paid and organic pushing each other up.
But watch the reverse: is paid cannibalizing organic? If rank rose but total installs didn't, you may have just shuffled the seat.
This makes measurement genuinely hard. If organic installs fell during a period of heavy paid scaling, did ASO get worse, or did paid simply capture people who were coming organically? The two call for opposite responses, and the store console alone cannot separate them. To read an ASO change cleanly, pick a window where ad spend was relatively stable.
The order to fix it
- Store page conversion (icon, screenshots, rating) — test a specific change.
- Keywords (name, subtitle) — widen visibility itself.
- Pair with paid to evaluate total installs and incrementality.
The order follows reversal cost and speed of effect. Screenshots are easy to change and revert and require testing to establish a benefit; the app name affects brand search and existing rank, and is hard to undo.
Detailed steps are in the ASO basics guide.
Try this today
Open your store console and read just two numbers: product page views and install conversion rate.
- Low page conversion (installs ÷ product page views) → review screenshots, description, ratings, traffic mix and measurement before testing a page change.
- Low browse conversion (product page views ÷ impressions) → review the icon, app name and source composition.
- Few impressions at all → review keywords, rank and search demand. Start with name and subtitle.
To see all three branches split by source at once, upload your store console CSV to the ASO store conversion tool. It calculates the funnel and the mix-versus-rate decomposition together.
That single branch decides what you work on for the next month. Trying to fix both at once, and being unable to attribute either result, is the most common waste in ASO.
If conversion has actually dropped, first separate the page from the traffic mix — app store conversion rate diagnosis has that decomposition, and app store A/B testing covers validating whatever you change.
Limits of this approach
ASO depends on store algorithms and policies, and those rules change often. There's no formula that guarantees a number-one rank. Treat it as a continuous experiment: change an element, then track rank and conversion and adjust.
It is also worth admitting that ASO results are hard to isolate. Free traffic has no network report, and ads, seasonality, and app releases all move in the same period. Recording change dates and comparing equal-length windows around them is the realistic best, and not declaring victory from a few days of movement matters more than any single tactic.