CPI, CPA, CPM and CPC divide advertising spend by different denominators. When a cost metric rises, inspect exposure costs and click, install or action rates first. CPM and CTR can describe a CPC change, but identifying auction, creative or targeting causes requires change history and further evidence.
For the full CPI, CPA, and ROAS chain, and which optimization metric to choose, start with the performance marketing metrics guide. This article compares all four cost metrics, then uses CPM and CPC to narrow the change.
Each cost attaches to a different funnel stage
| Metric | Formula | Question | Common misreading |
|---|---|---|---|
| CPM | Spend ÷ impressions × 1,000 | Has the price of exposure changed? | Cheap impressions do not guarantee valuable customers |
| CPC | Spend ÷ clicks | Has the price of a click changed? | Inspect CPM and CTR together |
| CPI | Spend ÷ installs | What did each install cost? | An install is not a new paying customer |
| CPA | Spend ÷ defined actions | What did each signup or purchase action cost? | Different action definitions cannot be compared directly |
Align currency, period and attribution scope. If a denominator is zero or missing, do not report zero cost. Distinguish CAC, the cost per new customer, from signup CPA or cost per order.
Lay it in one line and it clicks (numbers are illustrative). Spend $10,000 for 5M impressions → CPM $2. Of those, 50k clicks means 1% CTR, CPC $0.20. If 5,000 of those install, CPI $2. If 500 of them sign up, CPA $20. Stretched out like this, you see exactly where people drop and how cost compounds.
CPC went up — it is one of two causes
This is where the practical work starts. CPC is not an independent metric; it is CPM divided by (1,000 × CTR).
CPC = CPM ÷ (1,000 × CTR)
Enter CTR and the conversion rates below as fractions from 0 to 1 (1% = 0.01). These identities require the same period, population, conversion definitions, and attribution scope.
A rise in CPC can reflect higher CPM, lower CTR, or both changes together. This decomposition narrows hypotheses; it does not identify the operational cause.
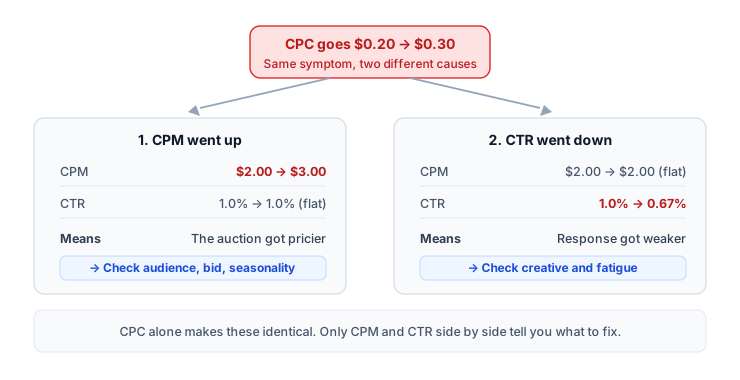
Run the numbers. At CPM $2.00 and CTR 1%, CPC is $0.20.
- CPM rises to $3.00 while CTR holds at 1% → CPC $0.30
- CPM holds at $2.00 while CTR falls to 0.67% → CPC approximately $0.30
Similar CPC, but the first reflects impression cost and the second reflects click response. Auctions, placement mix, creative, and audiences can change together. Check breakdowns and experiments before choosing an action.
When CPM rose
CPM is not a value you set — it is what the auction returns. Common reasons it climbs:
- The audience narrowed. Check whether impression cost changed after narrowing. Direction depends on inventory and competition.
- Competition intensified. Holiday and promotional periods pull budget onto the same inventory. CPM rises even when you changed nothing.
- Creative quality signals dropped. Platforms discount inventory for creative that earns engagement. Weak response raises effective CPM at the same bid.
- Placement mix shifted. With automatic placements, a larger share of expensive inventory lifts average CPM while per-placement efficiency is unchanged.
When CTR fell
This side is a response to something you made, so there is more to act on.
- Creative fatigue. Check whether CTR declined alongside repeated exposure; repetition alone does not establish a decline. Read it alongside frequency.
- Share of new creative. A drop in blended CTR can just be a larger mix of new assets still in learning.
- Message and audience drift apart. Check whether the message fits the expanded audience. Expansion does not guarantee a lower CTR.
Why you have to watch all of them
The same logic runs down the whole chain. CPA alone cannot tell you why it is bad; decomposing it narrows the hypotheses to investigate.
CPA = CPM ÷ (1,000 × CTR × click-to-install rate × install-to-action rate)
When CPA is high, this is where it splits:
- High CPM → tough auction competition or an expensive audience segment.
- Low CTR → check replacement candidates in creative fatigue analysis, or revisit targeting.
- Low conversion rate → leaking at the landing page or funnel.
So CPA is the result; CPM, CTR, and conversion rate are arithmetic components. Stare at the result alone and you cannot decide whether to swap creative, change targeting, or fix the landing page.
When CPI and CPA move in opposite directions
CPI and CPA have different denominators, so nothing guarantees they move together. The moments they diverge are the informative ones.
| What you see | Arithmetically possible path | Check first |
|---|---|---|
| CPI fell but CPA rose | Installs got cheaper while the install-to-action rate fell further | Whether creative or targeting shifted, and whether the installing users changed |
| CPA fell but CPI rose | Installs got pricier while those users converted at a much higher rate | Whether the expensive installs genuinely buy more, and whether recent days are still maturing |
| Both rose | Something upstream moved — CPM or CTR | Separate auction price from click-through rate before anything else |
Reuse the chain above and the reason surfaces. CPI = CPM ÷ (1,000 × CTR × click-to-install rate) and CPA = CPI ÷ install-to-action rate. Exactly one term sits between CPI and CPA, so when the two diverge, that term moved.
The common trap here is calling cheap installs bad traffic straight away. If your app records the action late, the most recent days have not matured and CPA looks worse than it is. Align the windows and look again; if they still diverge, put both metrics side by side per campaign in the operations dashboard to see which campaign is pulling the average.
What to optimize toward
Set the goal first, then pick the matching metric.
- Awareness campaign → CPM / reach
- Traffic → CPC
- App installs → CPI
- Revenue / signups → CPA (or ROAS)
One trap: optimize on an early metric (CPI) alone and you can pull in a flood of users who installed cheaply and never buy — the algorithm optimizes exactly the goal you hand it. When you can, push the optimization signal down toward the money-making action. See the full metric chain for how to choose by business stage.
Try this today
Open your report, put the last 7 days next to the previous 7, and build just three columns per campaign: CPM, CTR, CPC. Then for every campaign where CPC rose, ask one question. Did CPM move, or did CTR move?
That single split separates "campaigns that need new creative" from "campaigns that need a bid or audience change." Most of the time both are mixed together, and mixed together you cannot fix either properly.
One caution when comparing: day-level views manufacture trends out of weekday variation. Compare equal-length windows, and drop the most recent days that have not matured for metrics whose conversions land late.
Limits of this approach
A cheap CPI isn't a good campaign. Whether those users stay (retention) and buy (LTV) is what reveals true efficiency. Use the early metrics for diagnosis, and make the final call on the later ones.
And the CPM/CTR split narrows where to look — it does not prove cause. If seasonality, competition, and creative all changed in the same week, this table cannot tell you which one did it. When you need certainty, move to a design with a comparison group, such as incrementality testing.
If building those three columns per campaign every week gets tedious, upload your report CSV to the operations dashboard. It lines up CPM, CTR, CPC, and CPA as a period comparison and flags which cell moved. Data is processed in your browser and never sent to a server.